Experimental design
## [1] "Total shoot observations: 131510"## [1] "Total years: 14"## [1] "Total shoot trajectories: 11565"## # A tibble: 4 × 4
## site variable mean sd
## <chr> <chr> <dbl> <dbl>
## 1 cfc mat 4.78 1.20
## 2 cfc tap 912. 178.
## 3 hwrc mat 3.84 1.19
## 4 hwrc tap 716. 107.Treatments
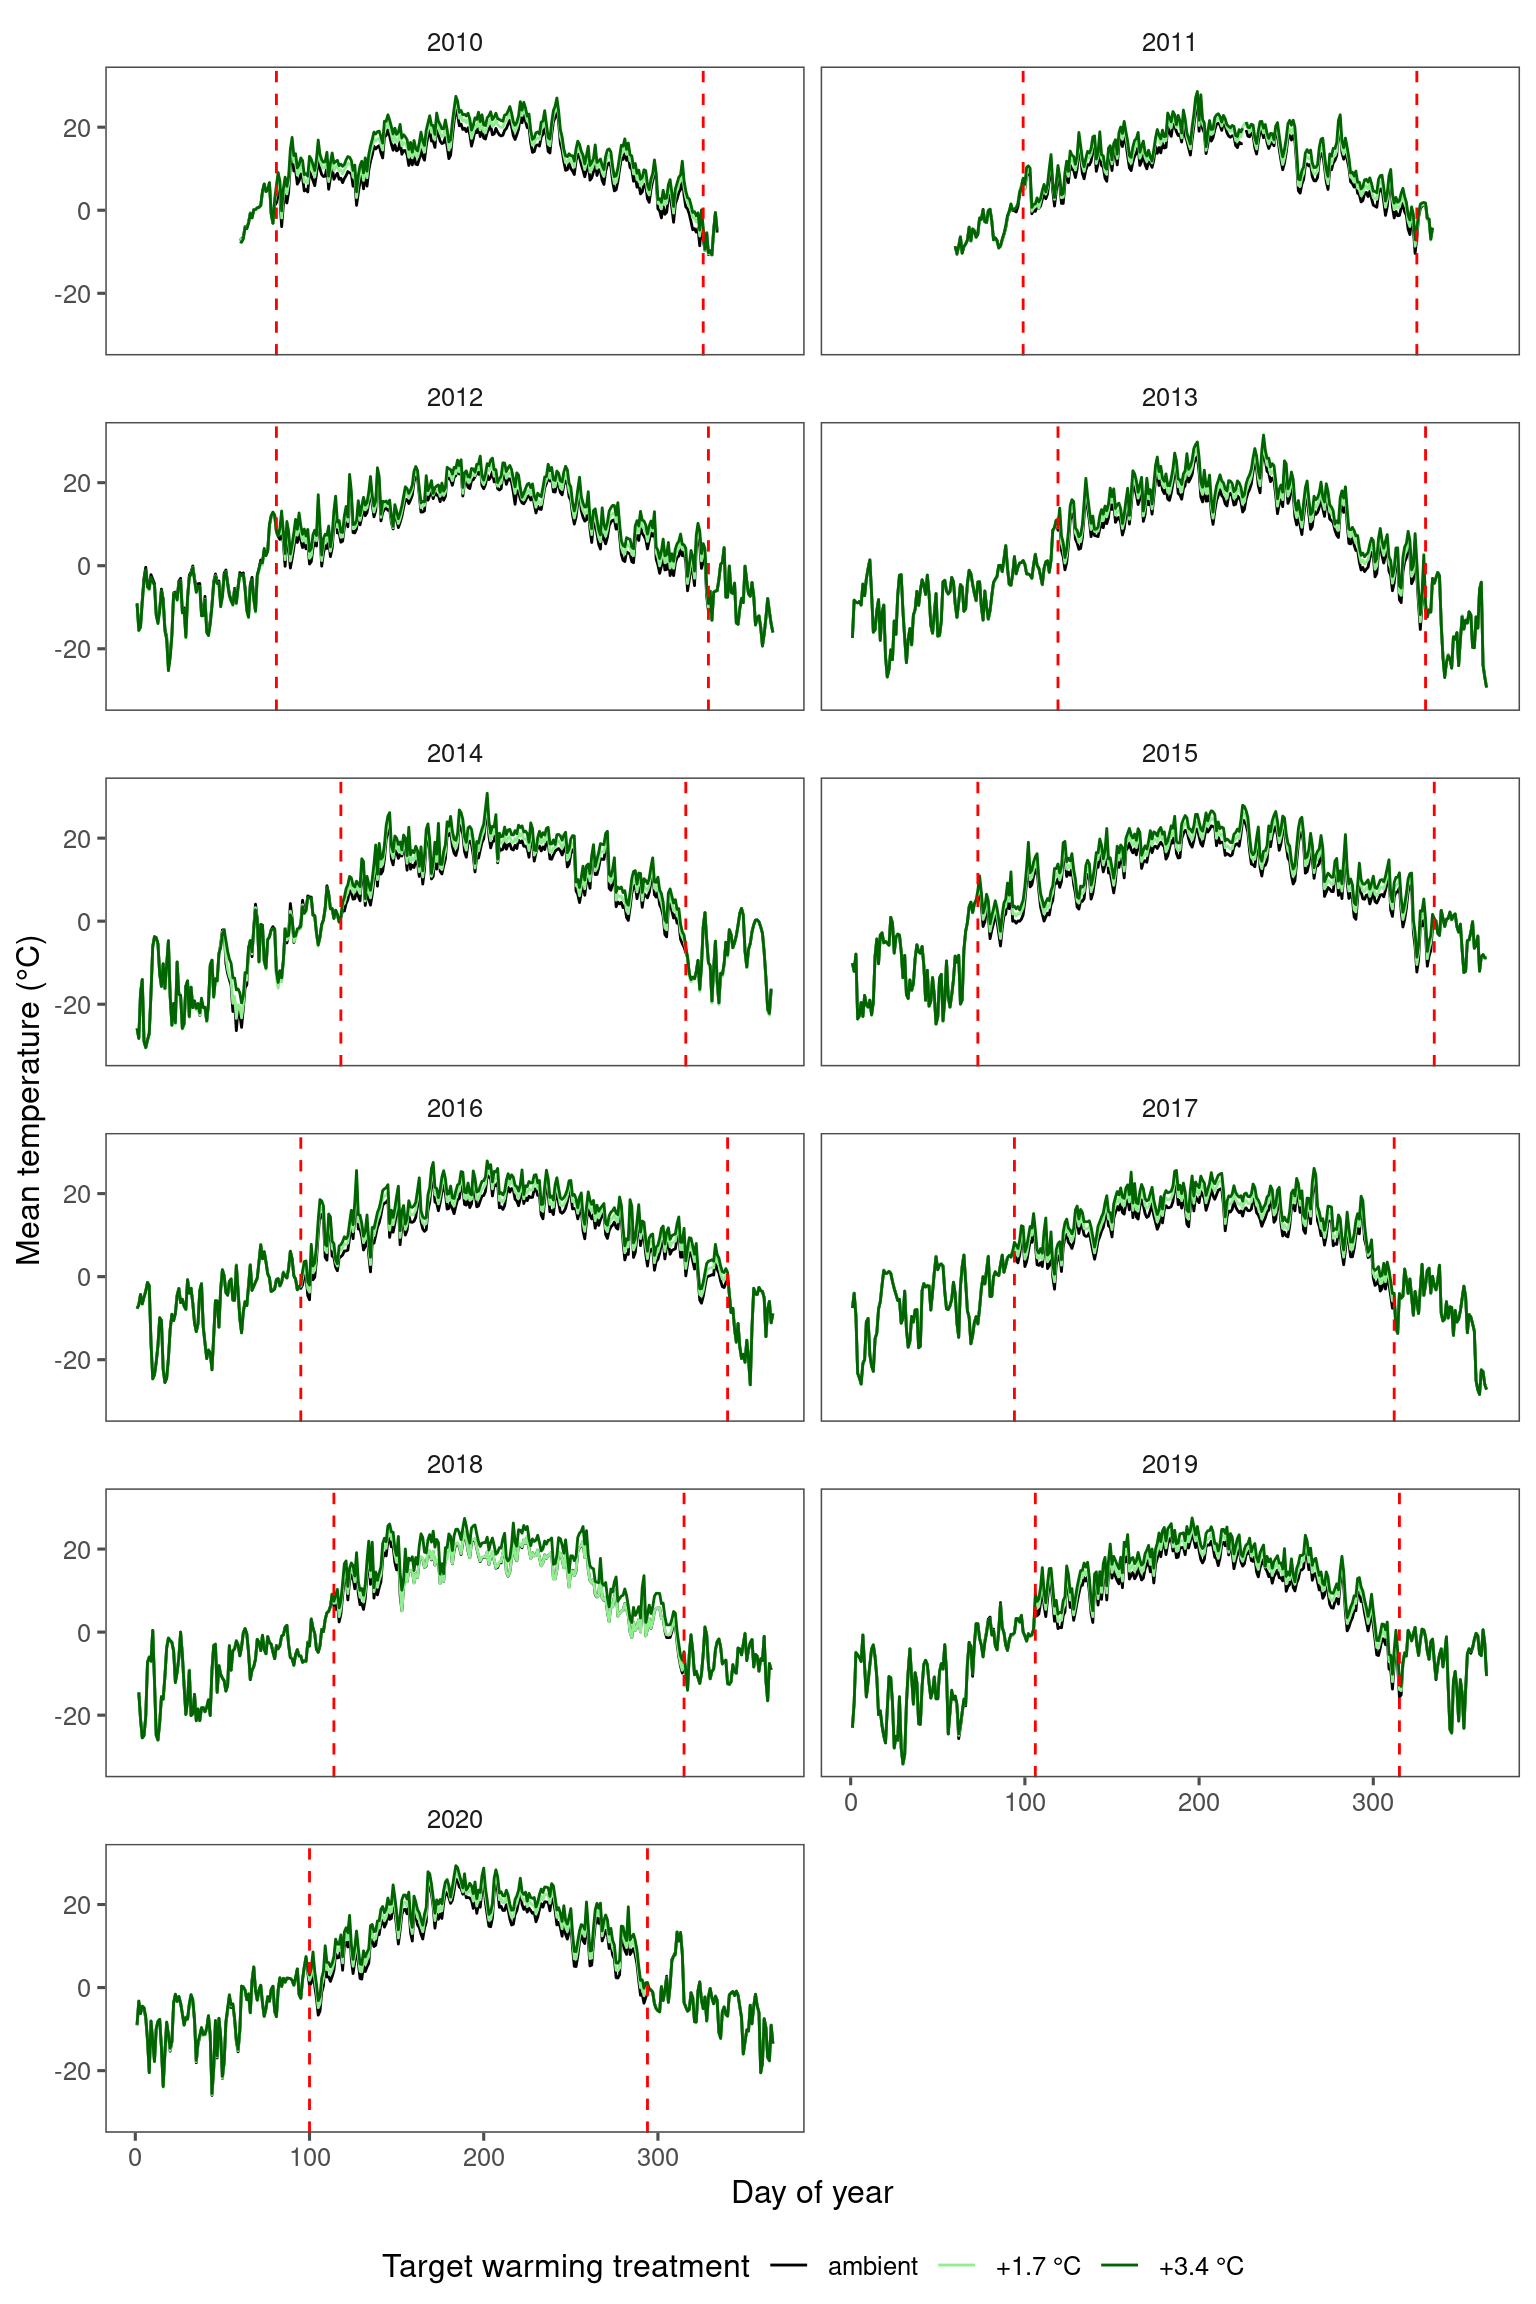
target warming treatment | rainfall treatment | canopy | difference in | difference in |
|---|---|---|---|---|
+1.7 °C | ambient | closed | 1.68 ± 0.526 | -0.00857 ± 0.0300 |
+3.4 °C | ambient | closed | 3.42 ± 0.469 | -0.0264 ± 0.0257 |
+1.7 °C | ambient | open | 1.59 ± 0.383 | -0.0212 ± 0.0219 |
+3.4 °C | ambient | open | 3.12 ± 0.436 | -0.0385 ± 0.0209 |
+1.7 °C | reduced | open | 1.52 ± 0.505 | -0.0186 ± 0.0147 |
+3.4 °C | reduced | open | 3.08 ± 0.565 | -0.0450 ± 0.0287 |
target warming treatment | difference in | difference in |
|---|---|---|
+1.7 °C | 1.62 ± 0.483 | -0.0146 ± 0.0257 |
+3.4 °C | 3.26 ± 0.506 | -0.0340 ± 0.0261 |
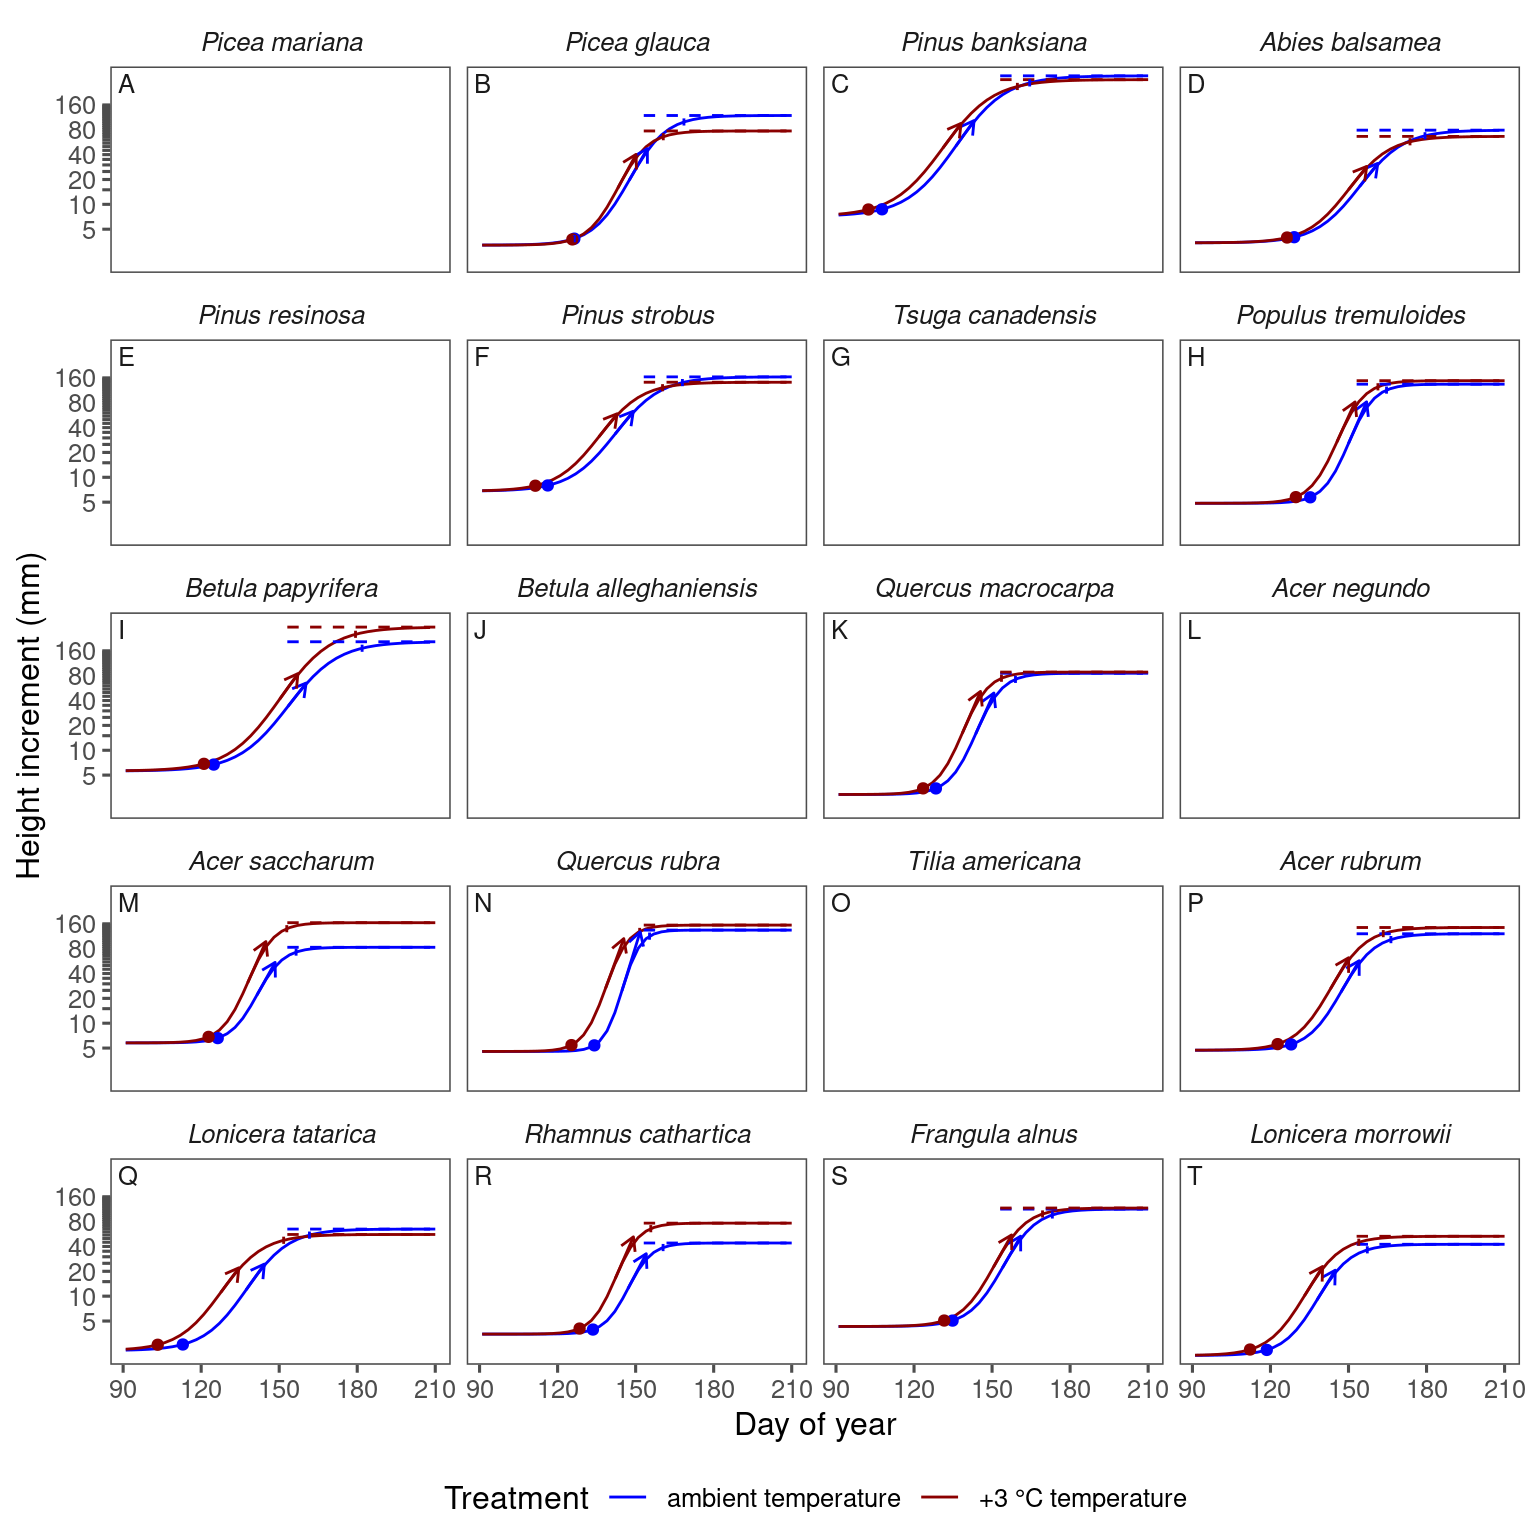
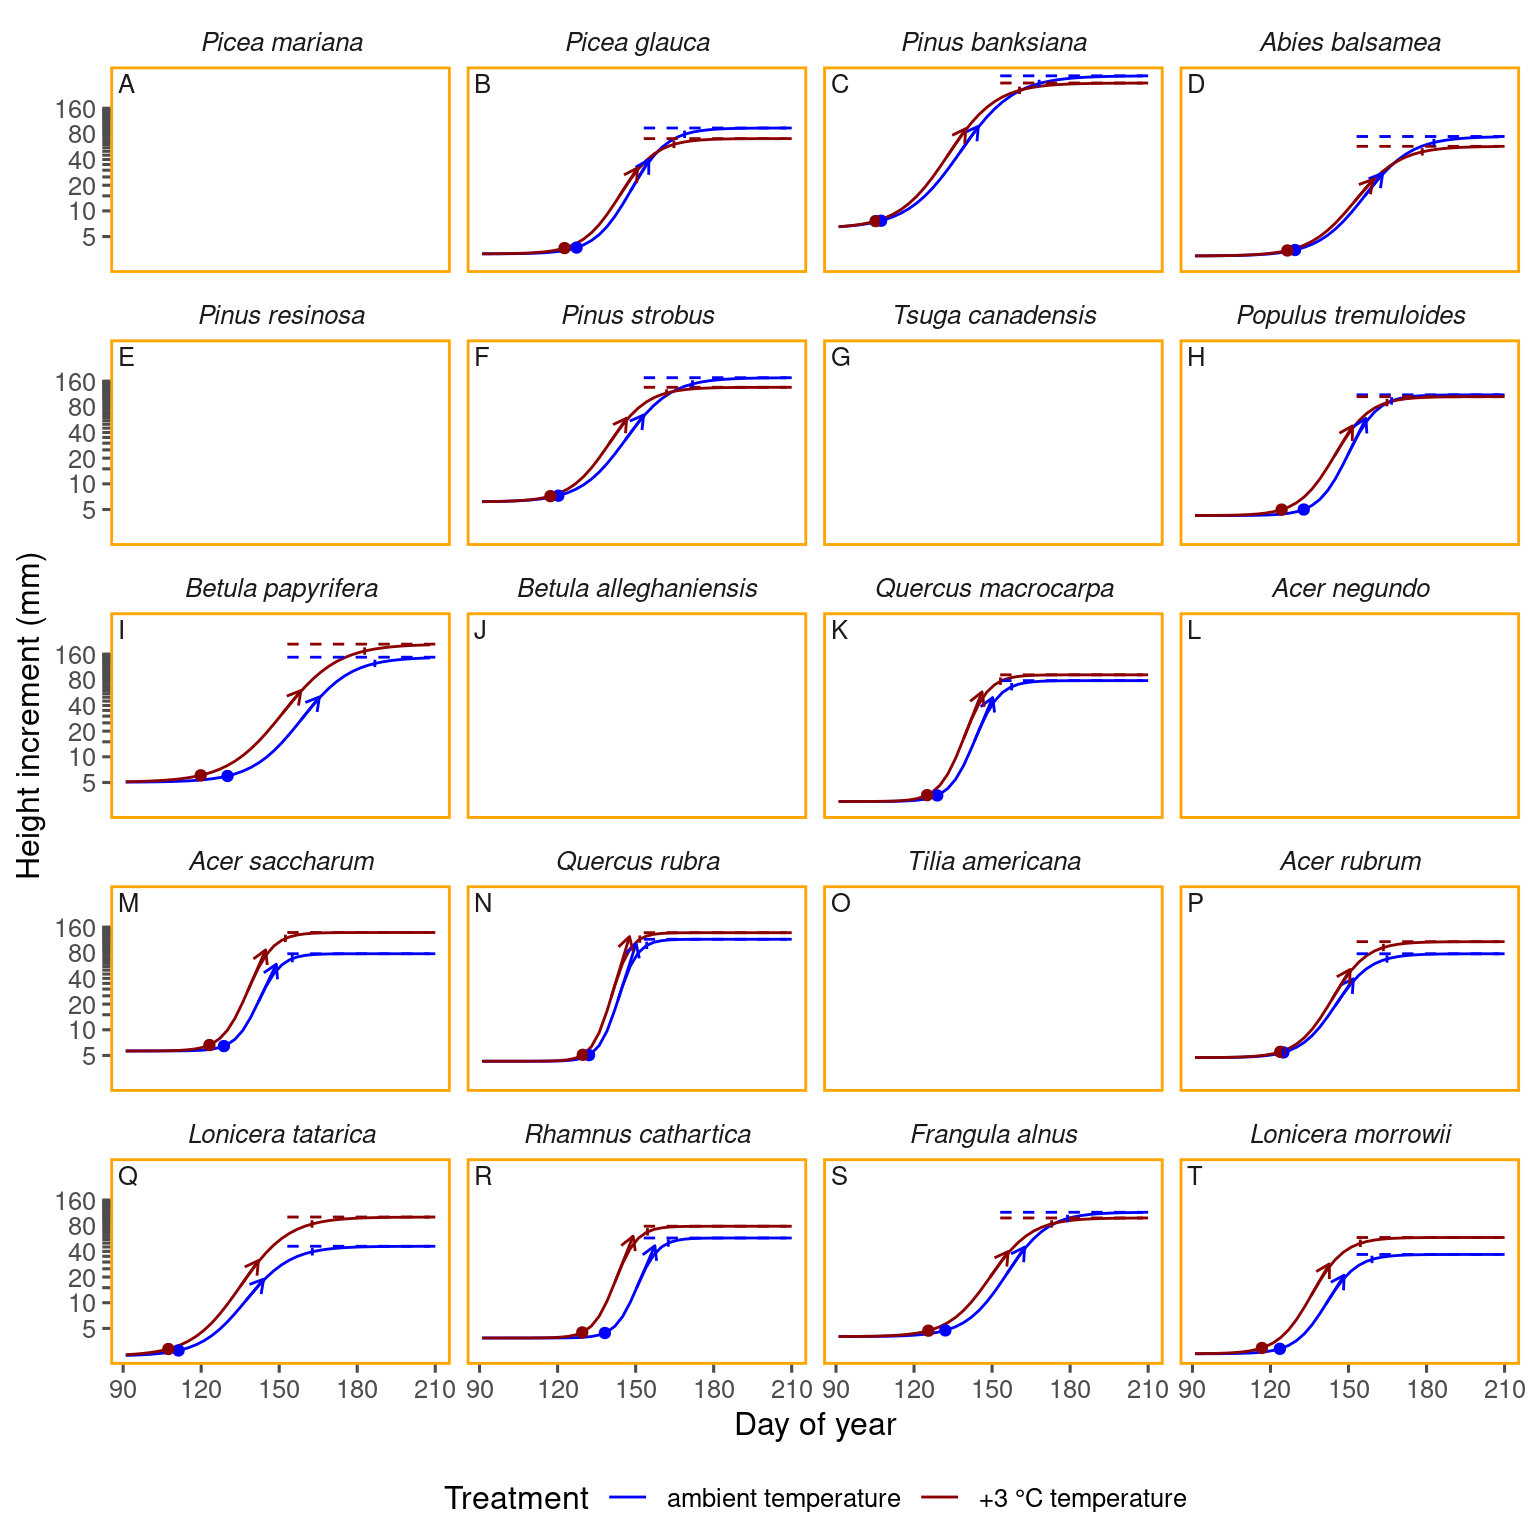
Model results
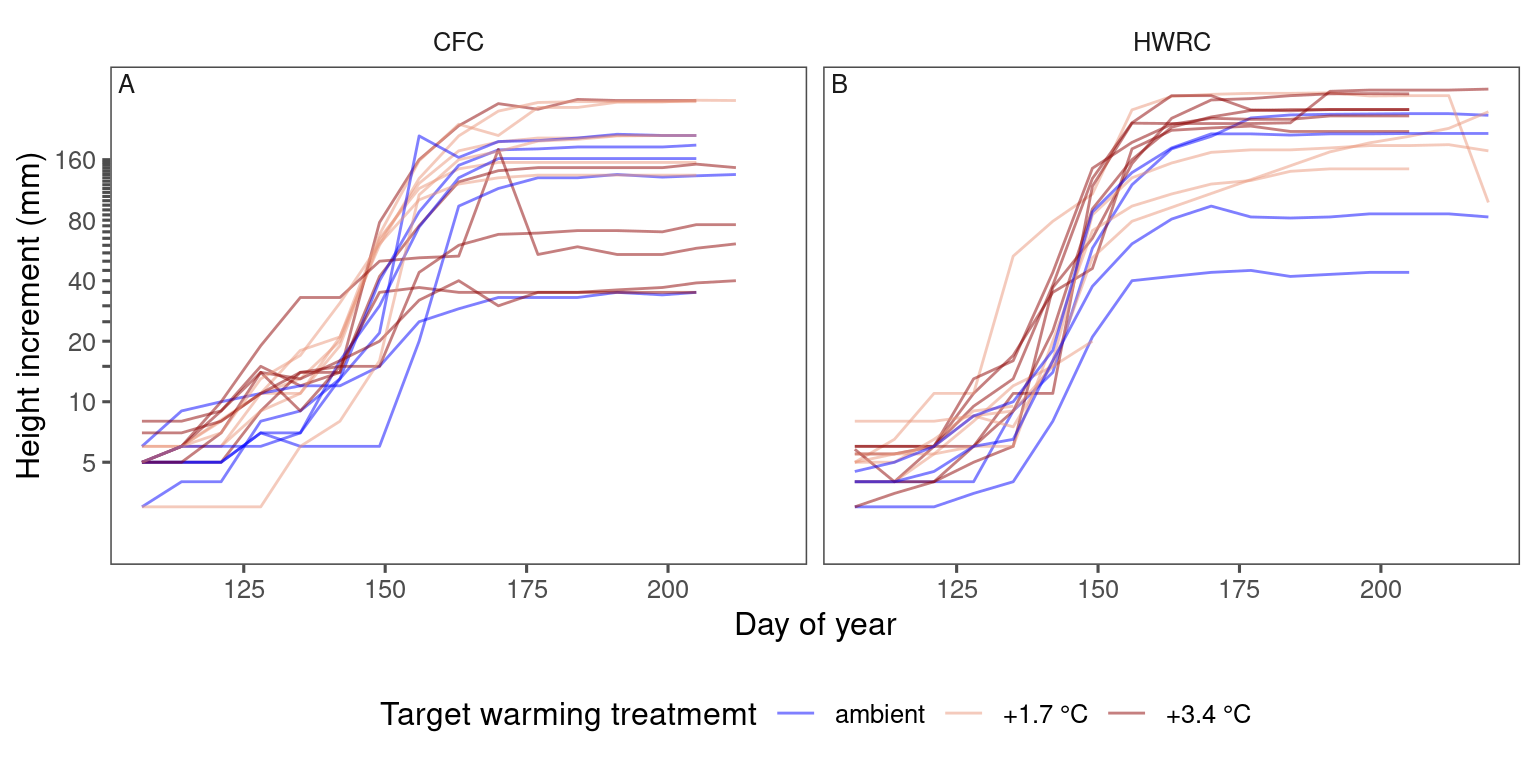
Data snapshot
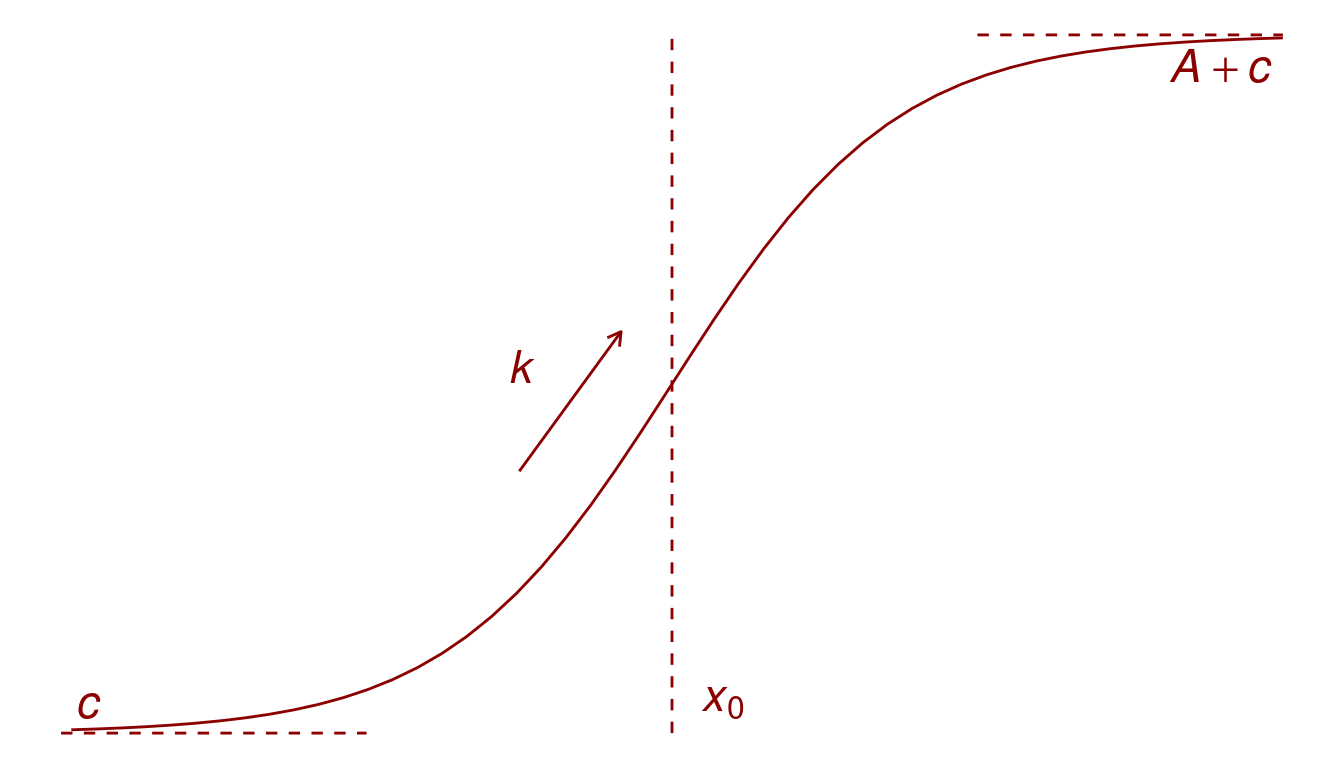
Conceptual
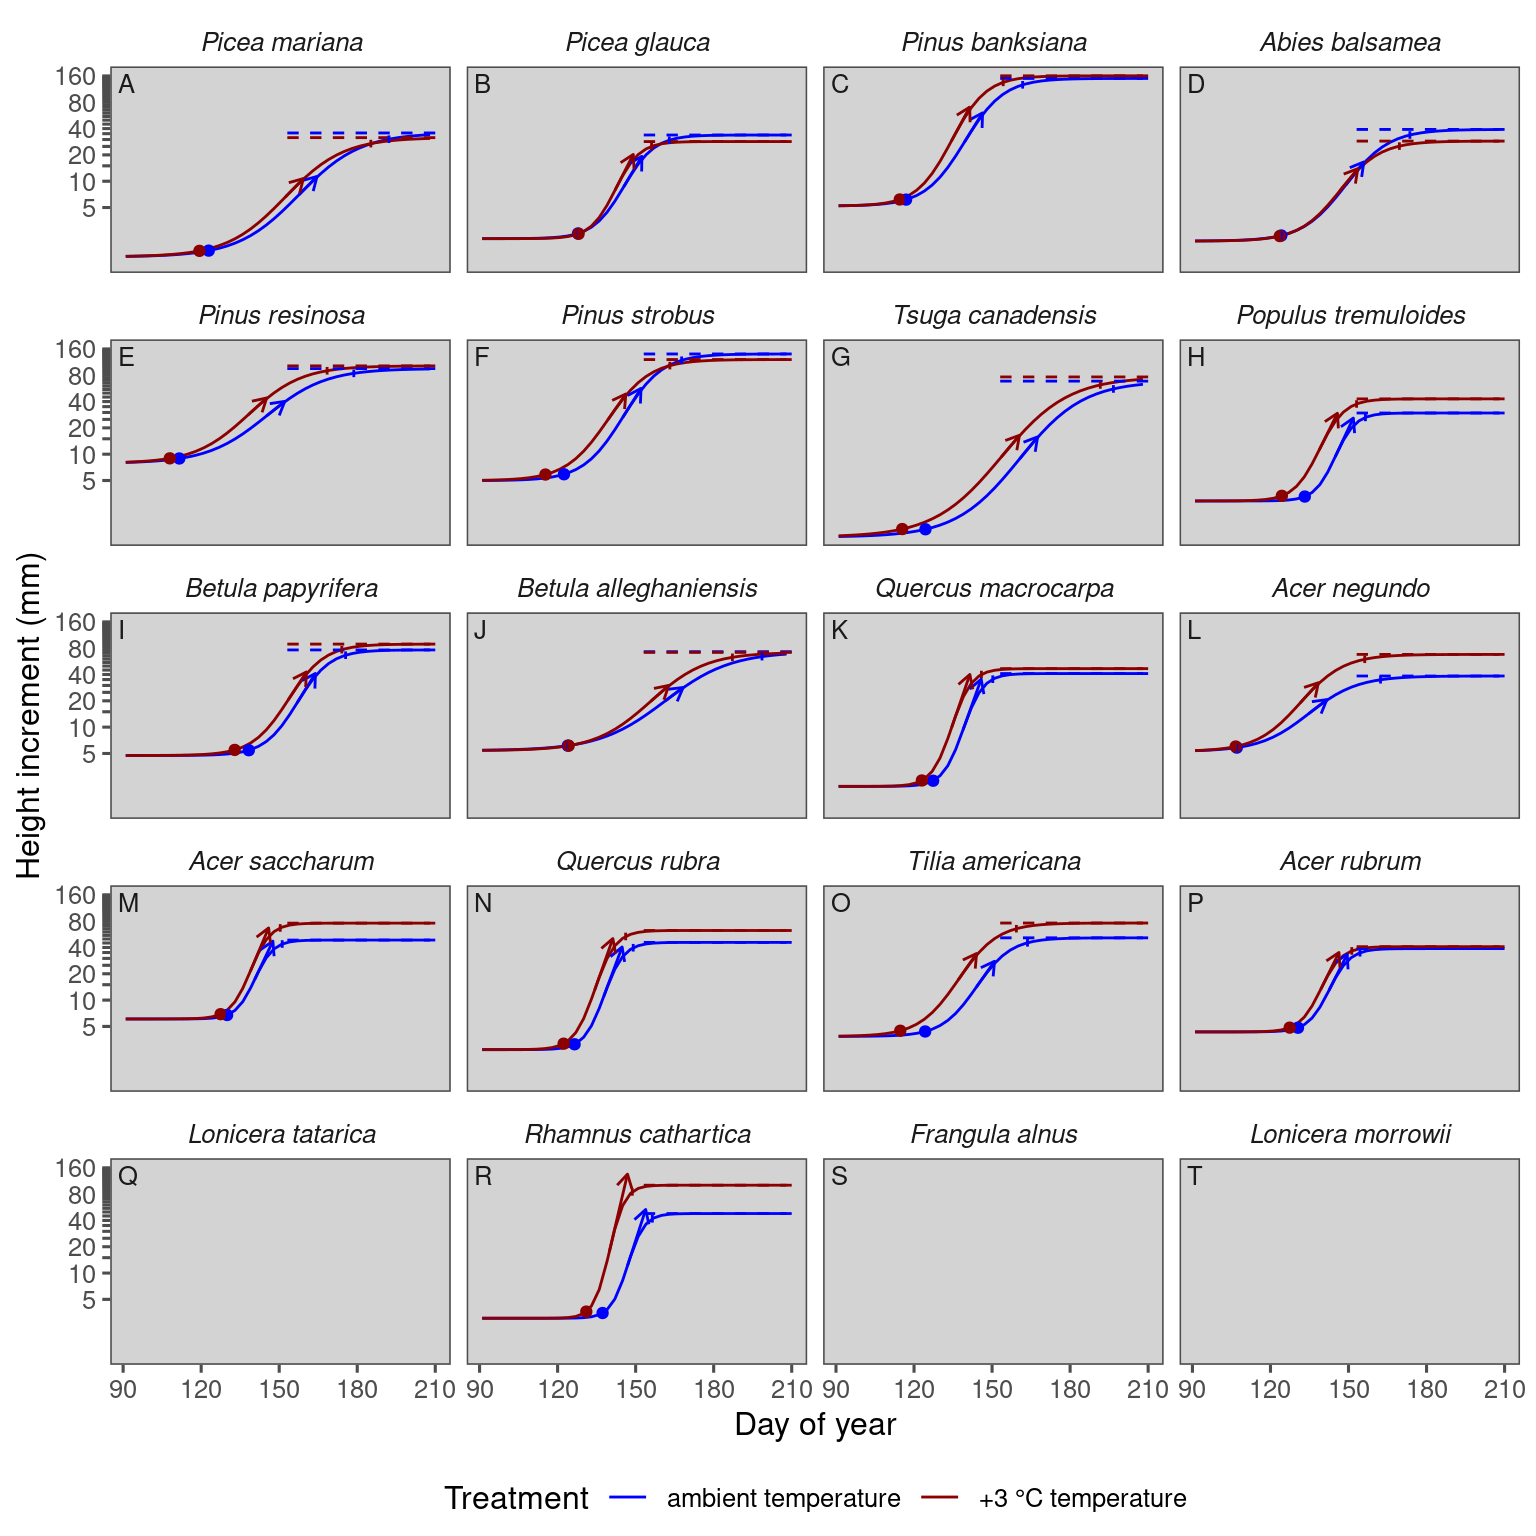
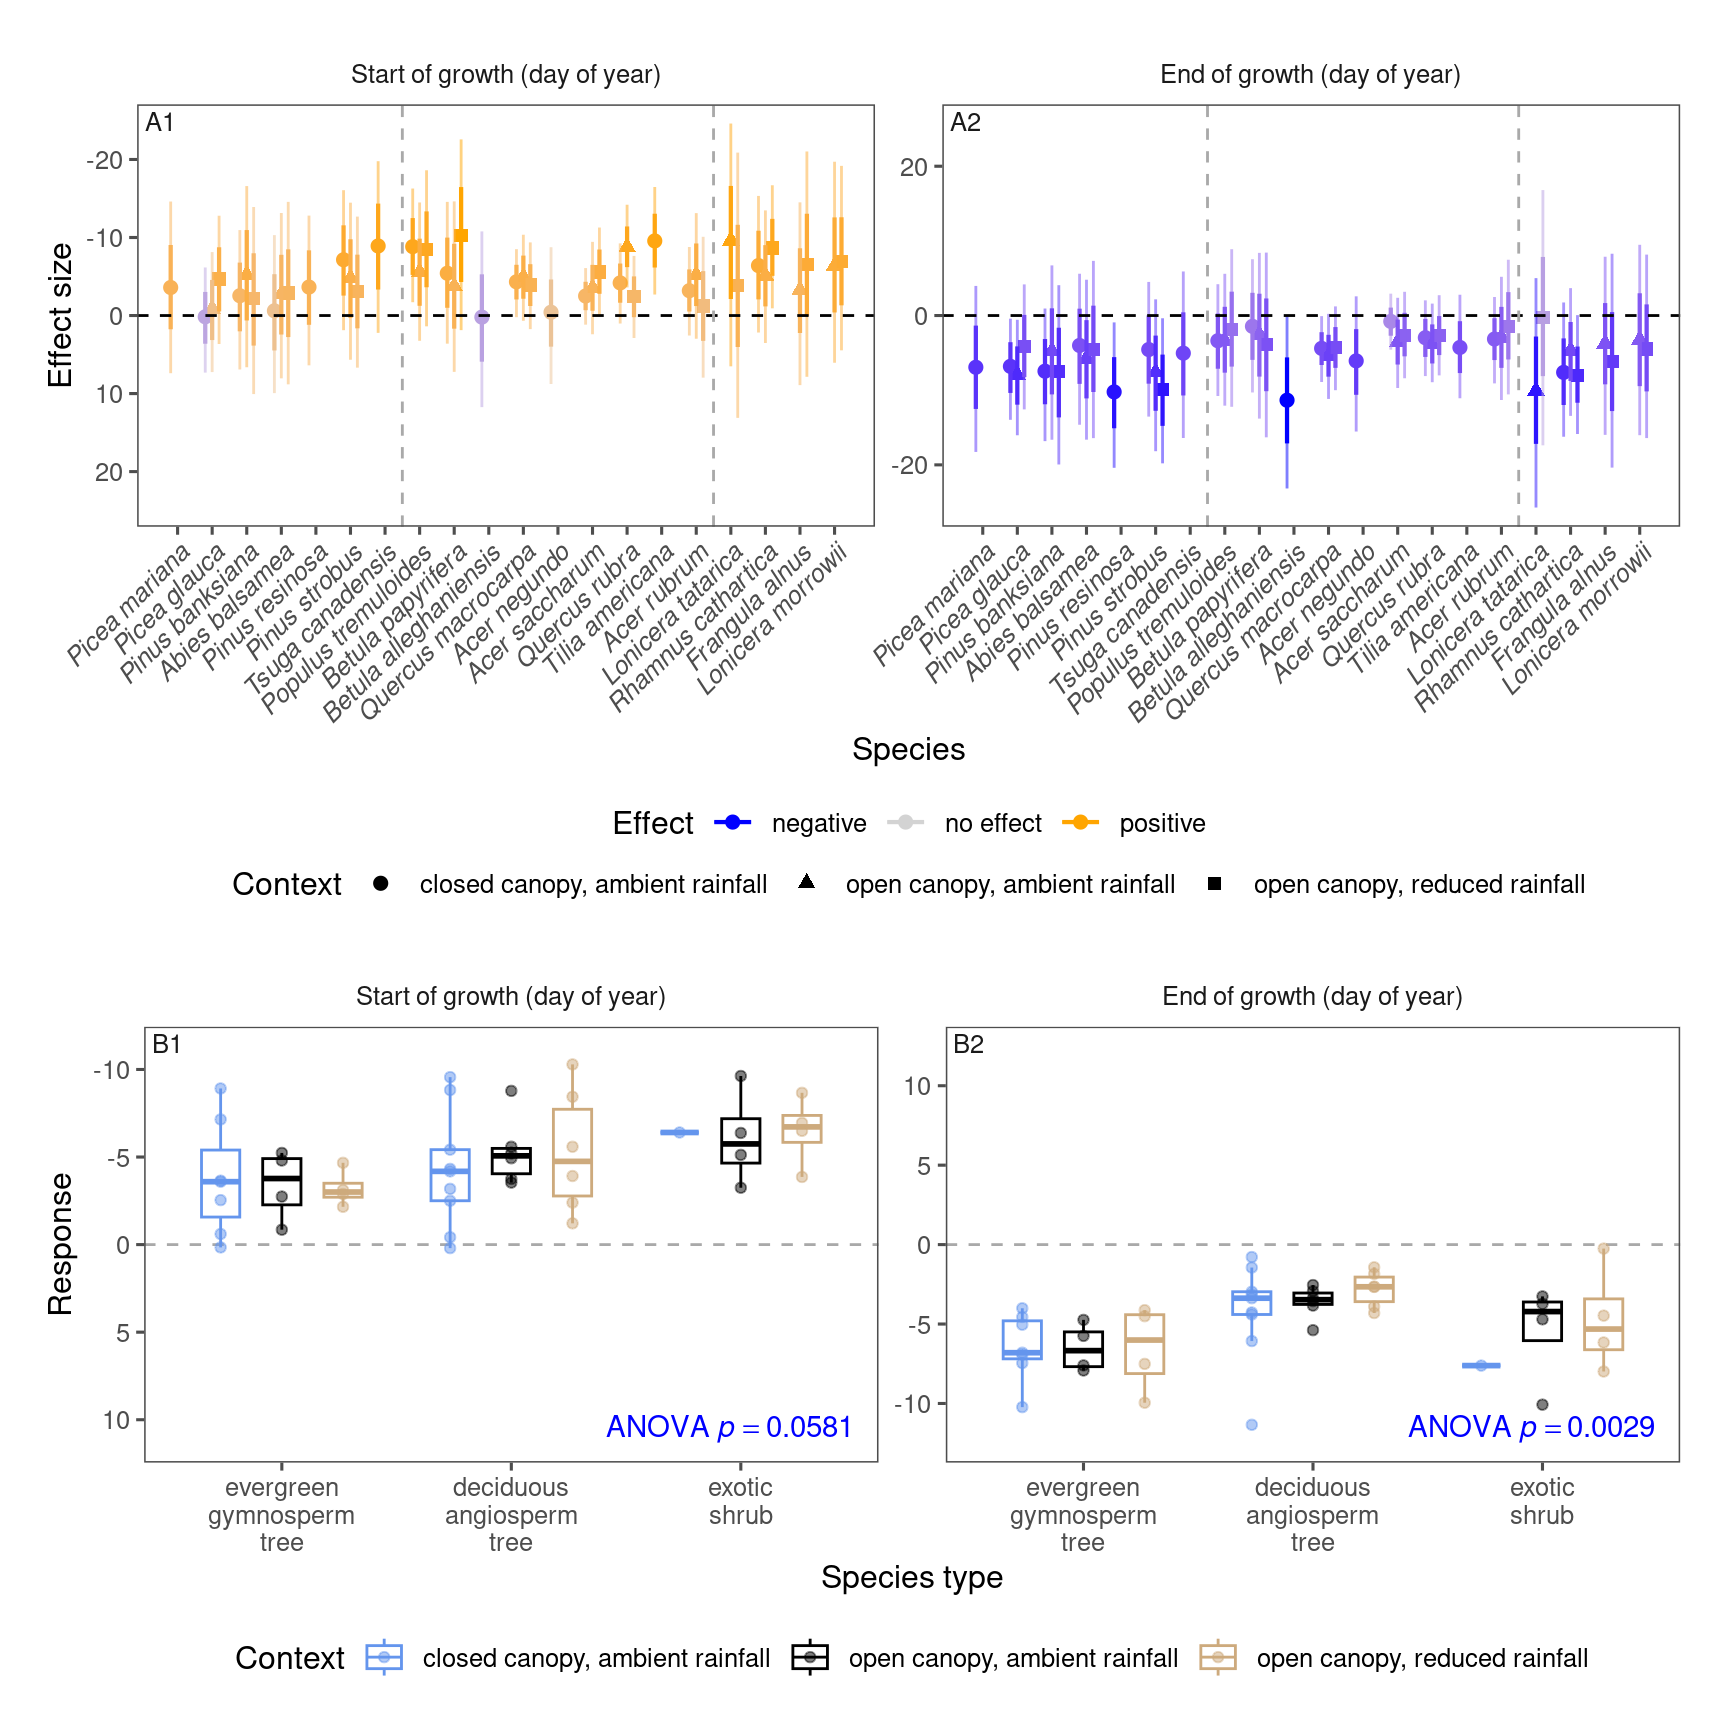
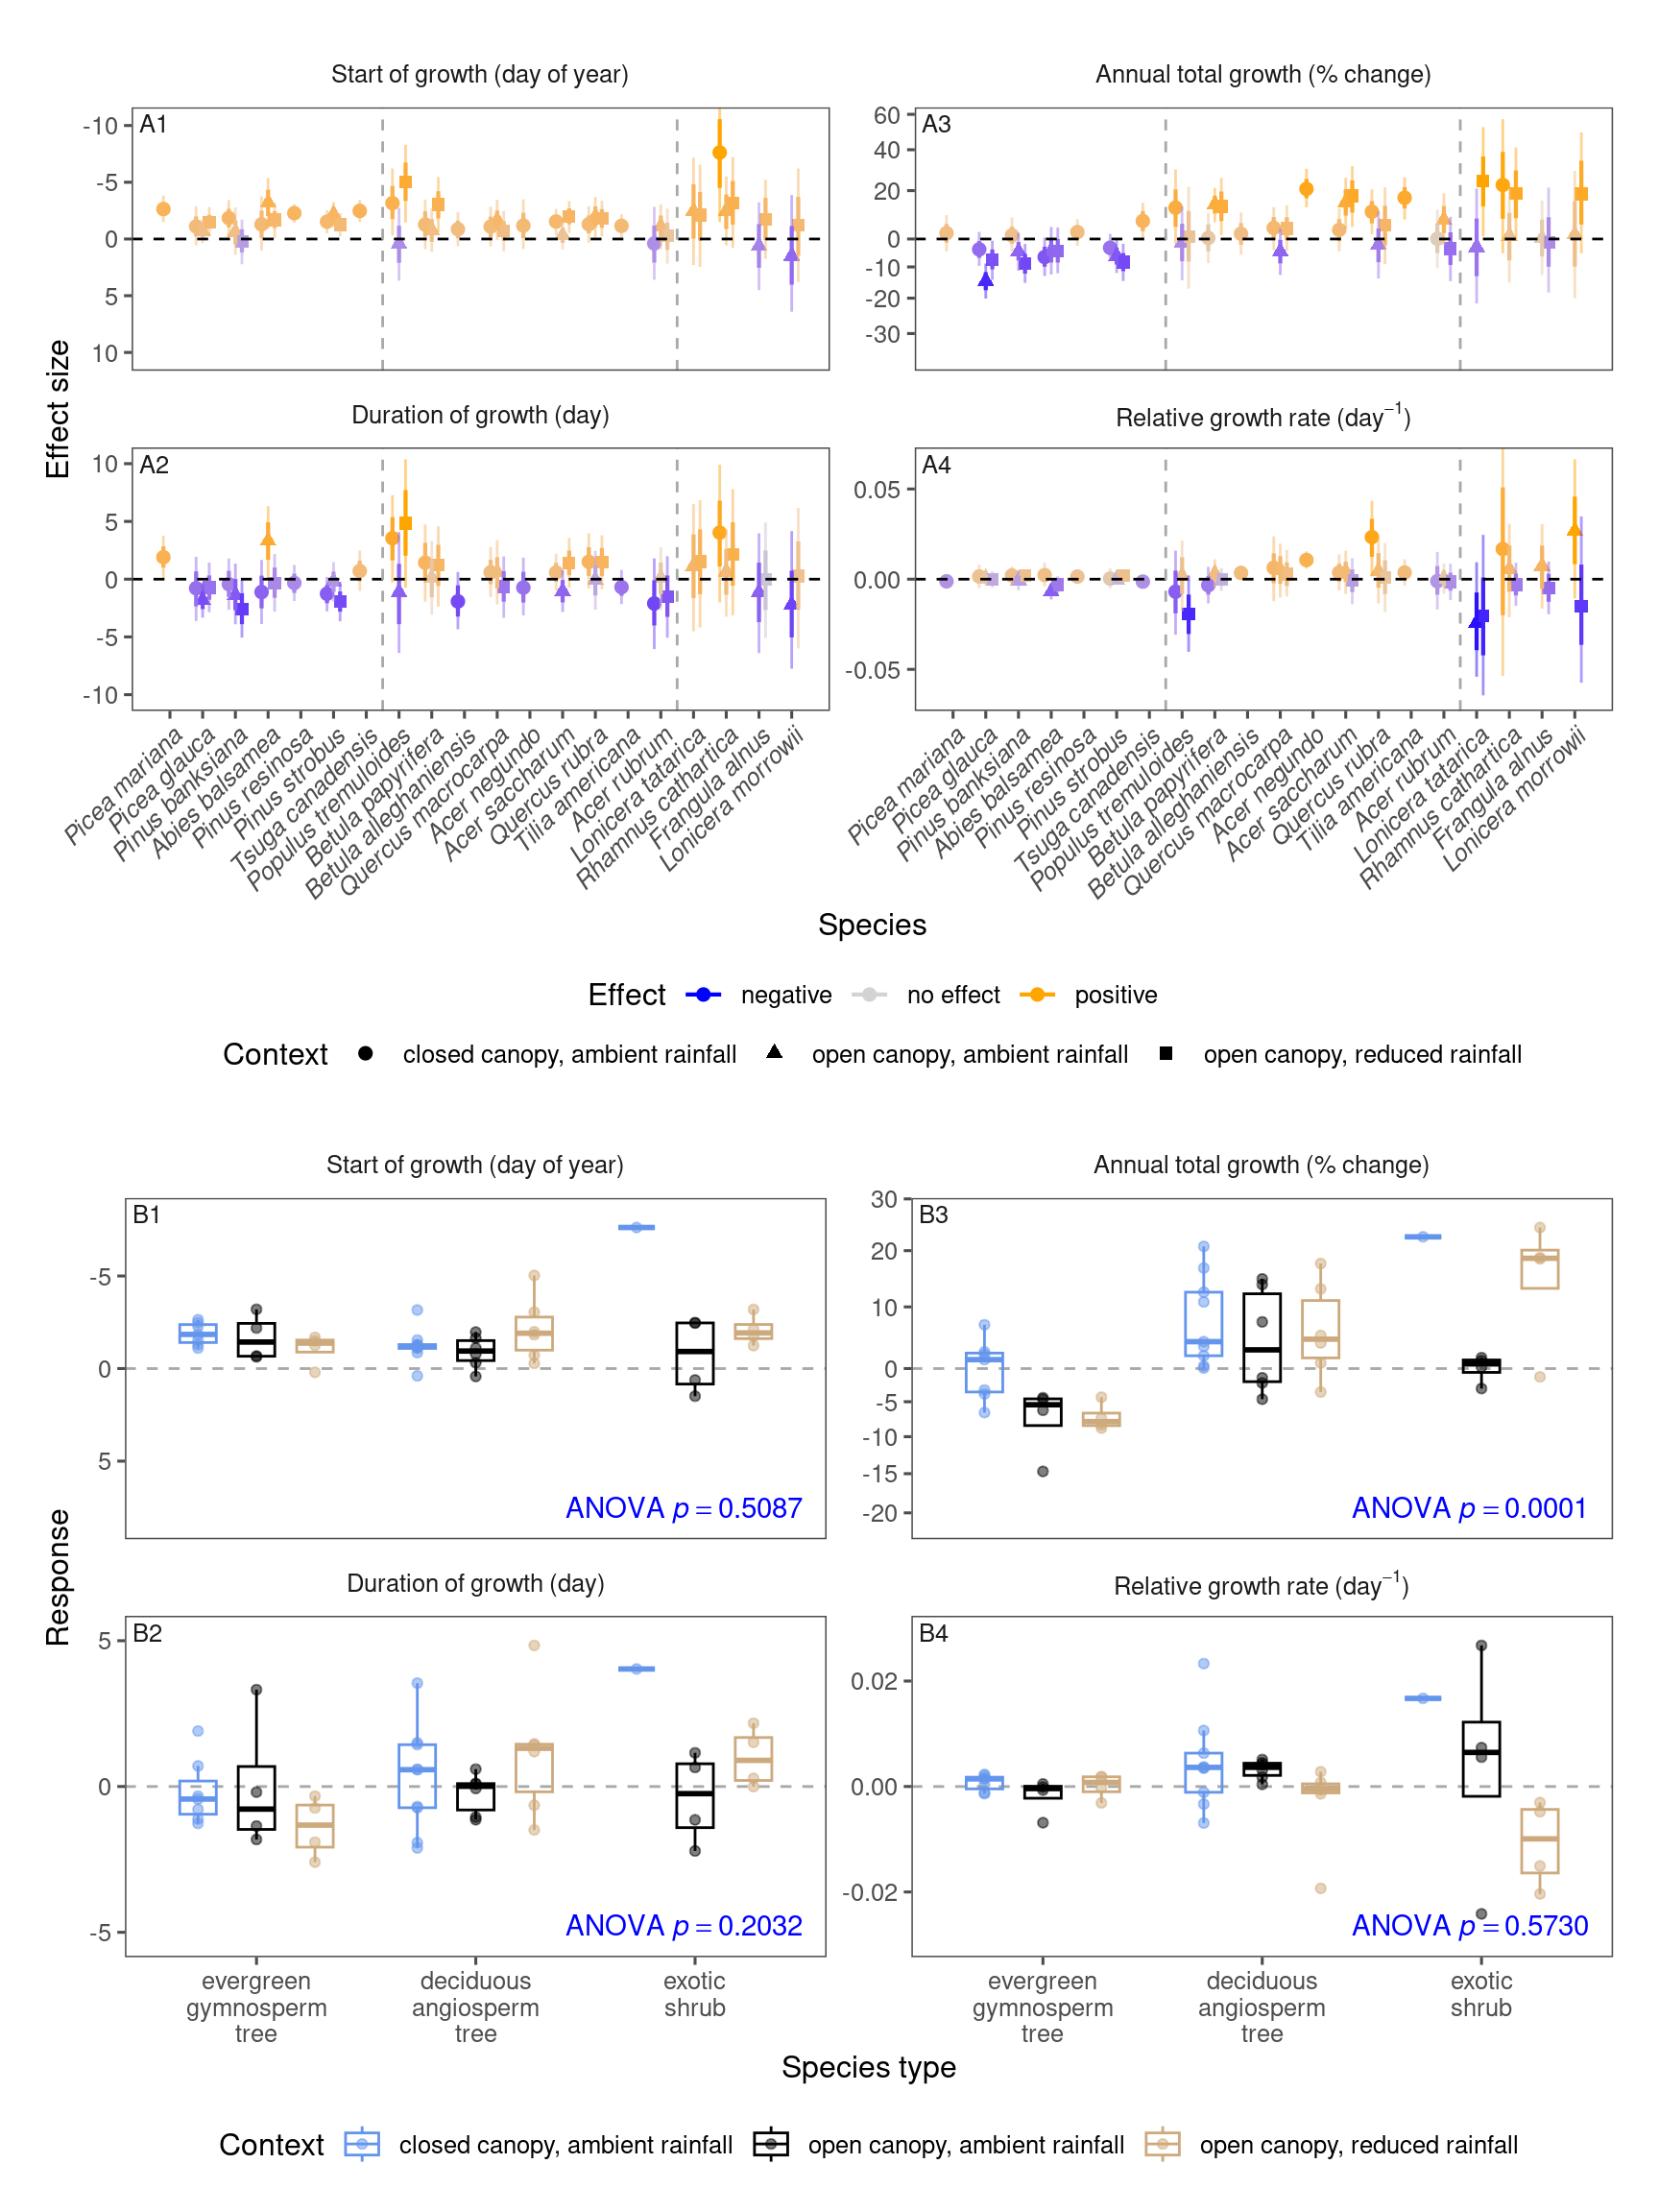
Modeled effects
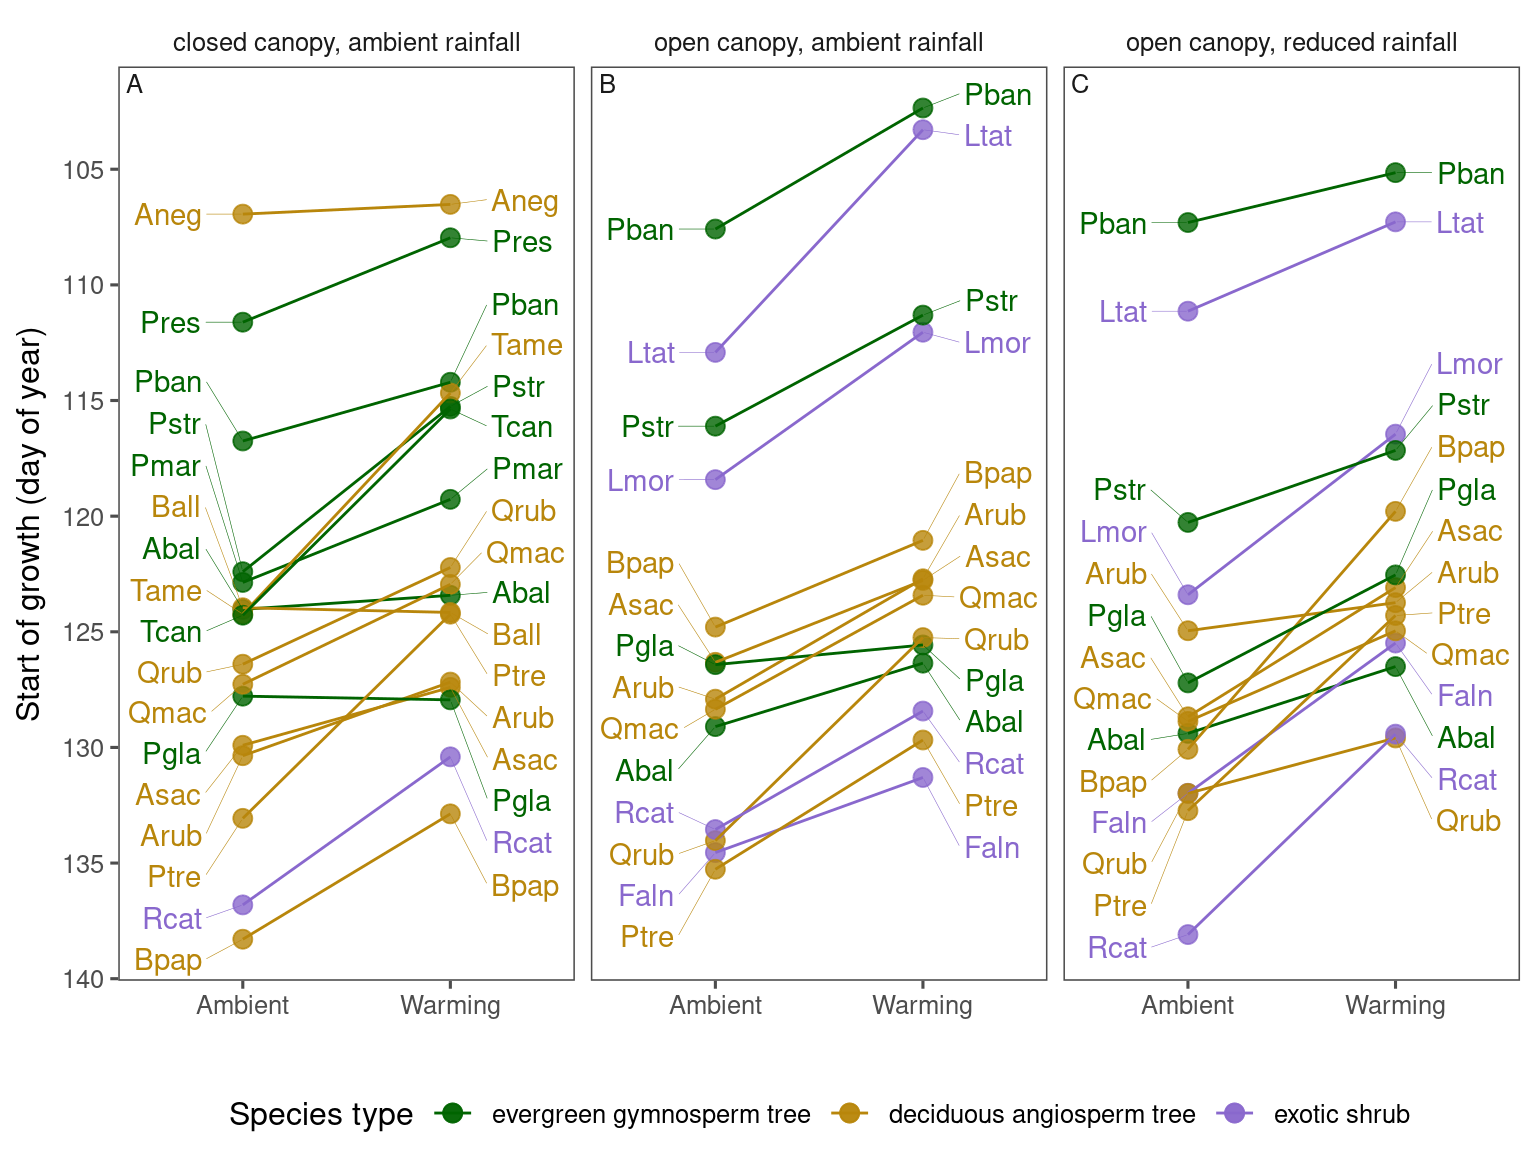
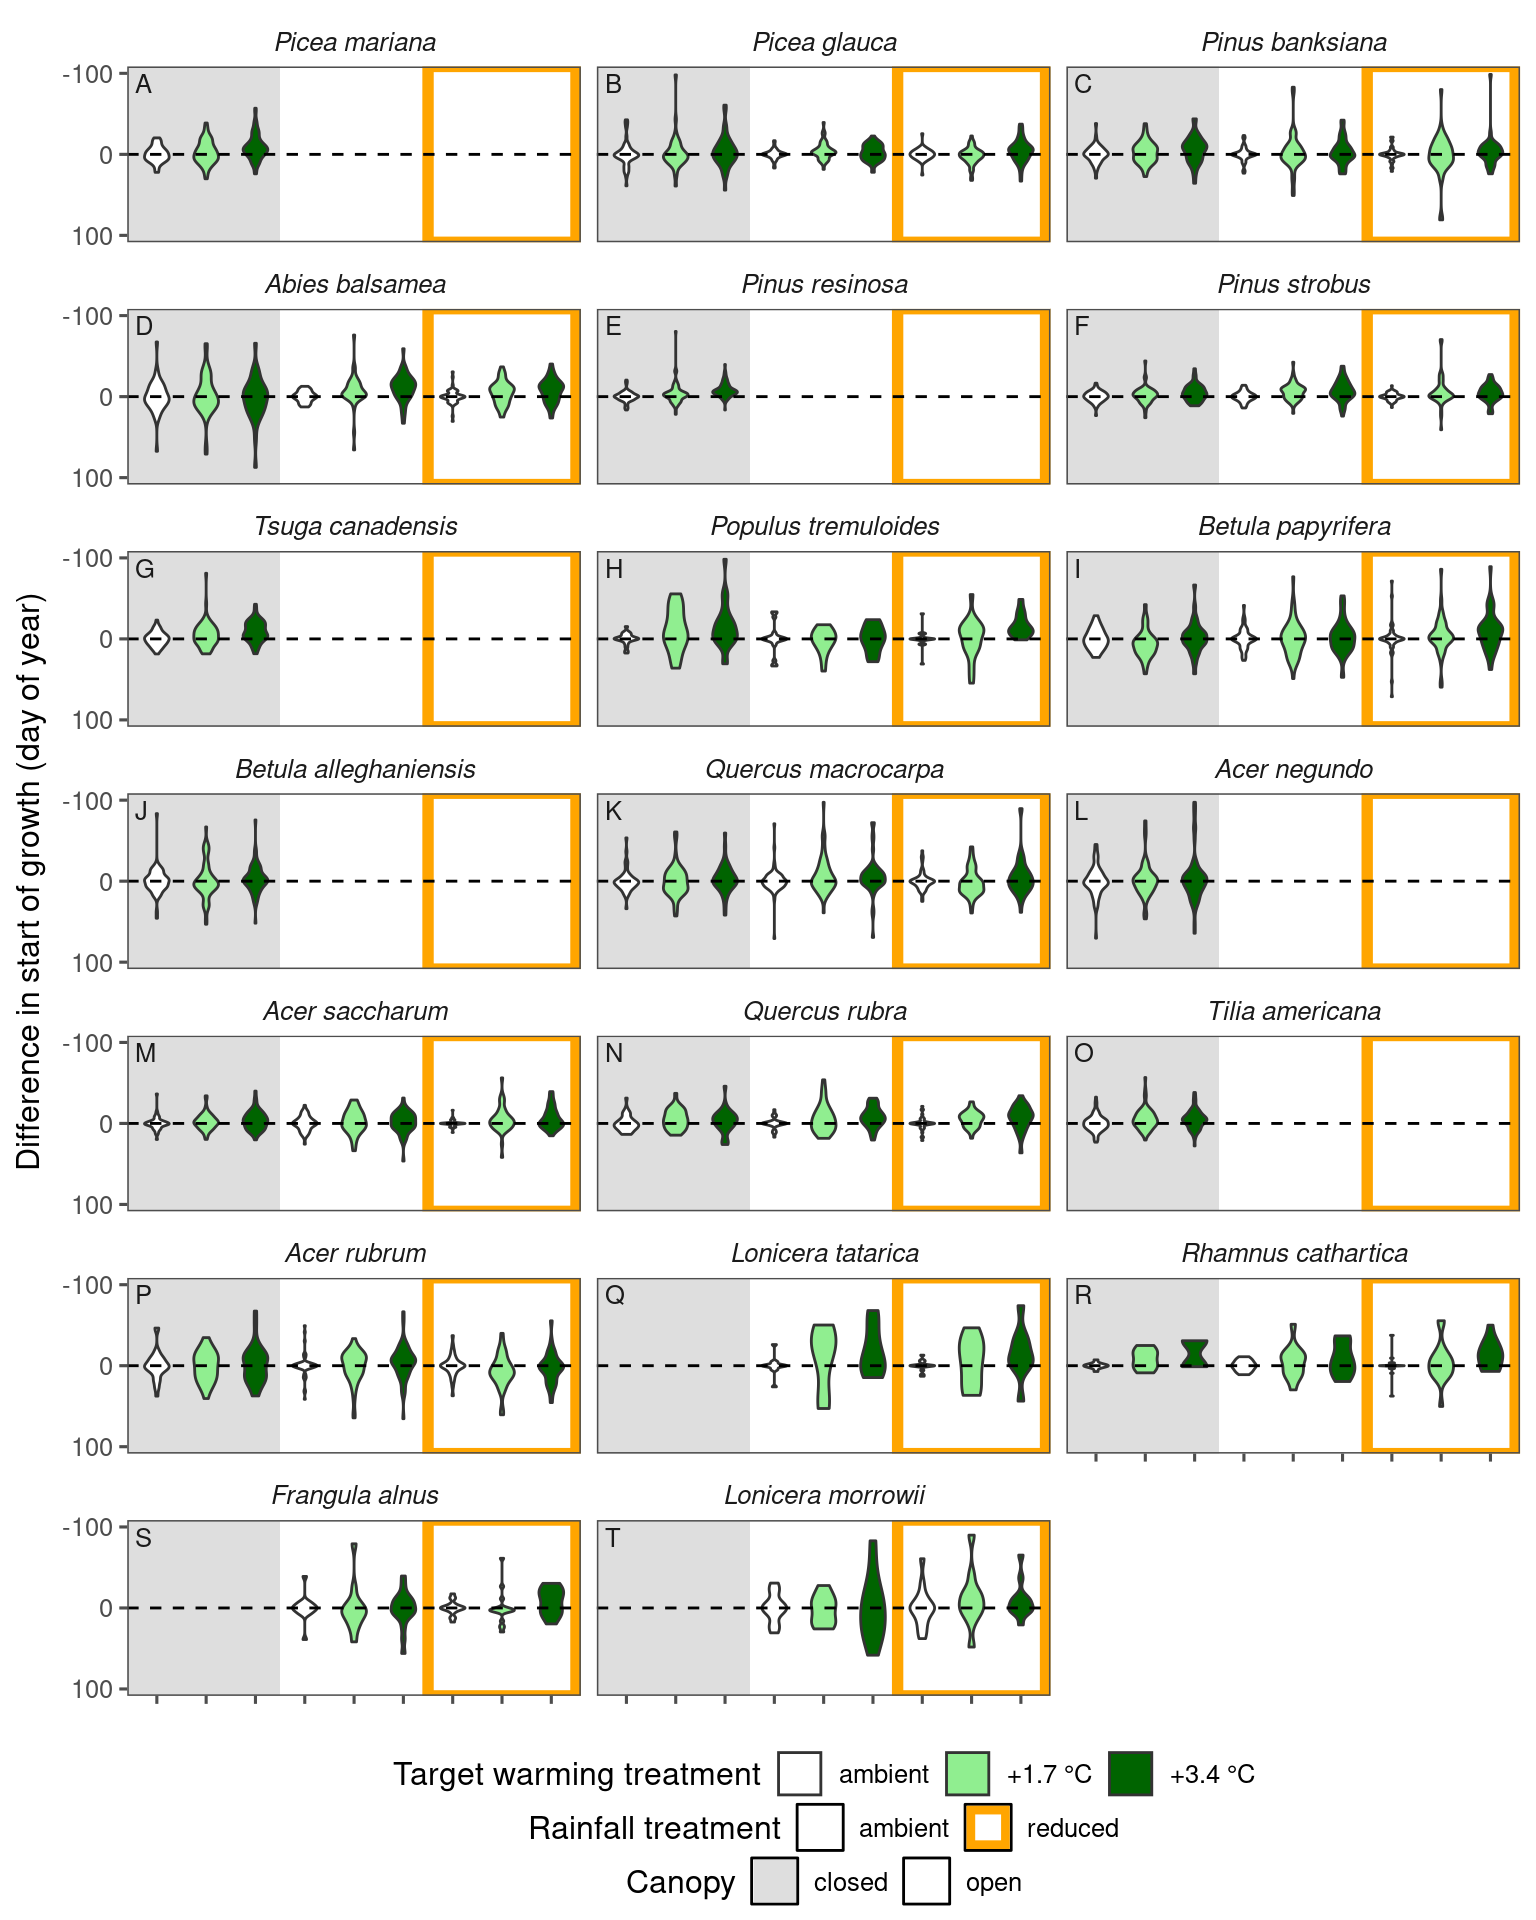
(A) start of growth | |||
|---|---|---|---|
species | closed canopy, | open canopy, | open canopy, |
Picea mariana | -3.59 | ||
Picea glauca | 0.160 | -0.851 | -4.67 |
Pinus banksiana | -2.54 | -5.23 | -2.16 |
Abies balsamea | -0.606 | -2.74 | -2.89 |
Pinus resinosa | -3.65 | ||
Pinus strobus | -7.15 | -4.80 | -3.11 |
Tsuga canadensis | -8.91 | ||
Populus tremuloides | -8.83 | -5.59 | -8.44 |
Betula papyrifera | -5.42 | -3.75 | -10.3 |
Betula alleghaniensis | 0.202 | ||
Quercus macrocarpa | -4.32 | -4.93 | -3.92 |
Acer negundo | -0.420 | ||
Acer saccharum | -2.50 | -3.54 | -5.59 |
Quercus rubra | -4.18 | -8.78 | -2.40 |
Tilia americana | -9.56 | ||
Acer rubrum | -3.18 | -5.21 | -1.21 |
Lonicera tatarica | -9.63 | -3.86 | |
Rhamnus cathartica | -6.40 | -5.12 | -8.67 |
Frangula alnus | -3.25 | -6.50 | |
Lonicera morrowii | -6.37 | -6.95 | |
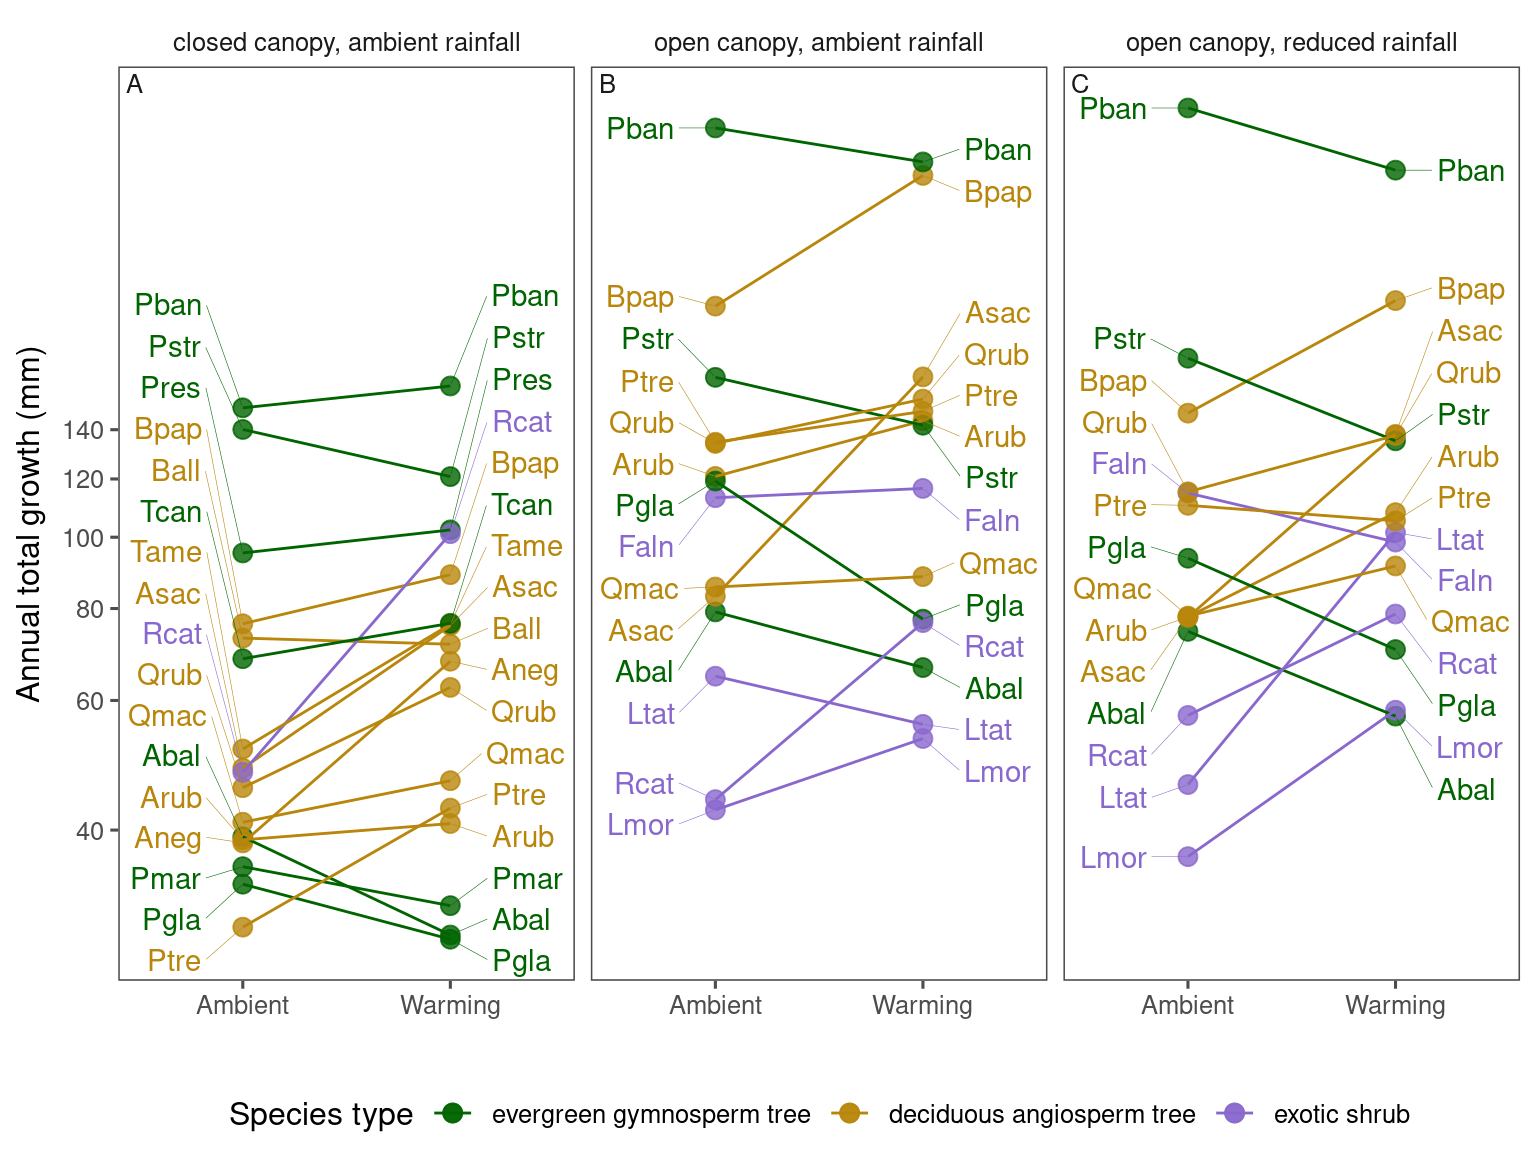
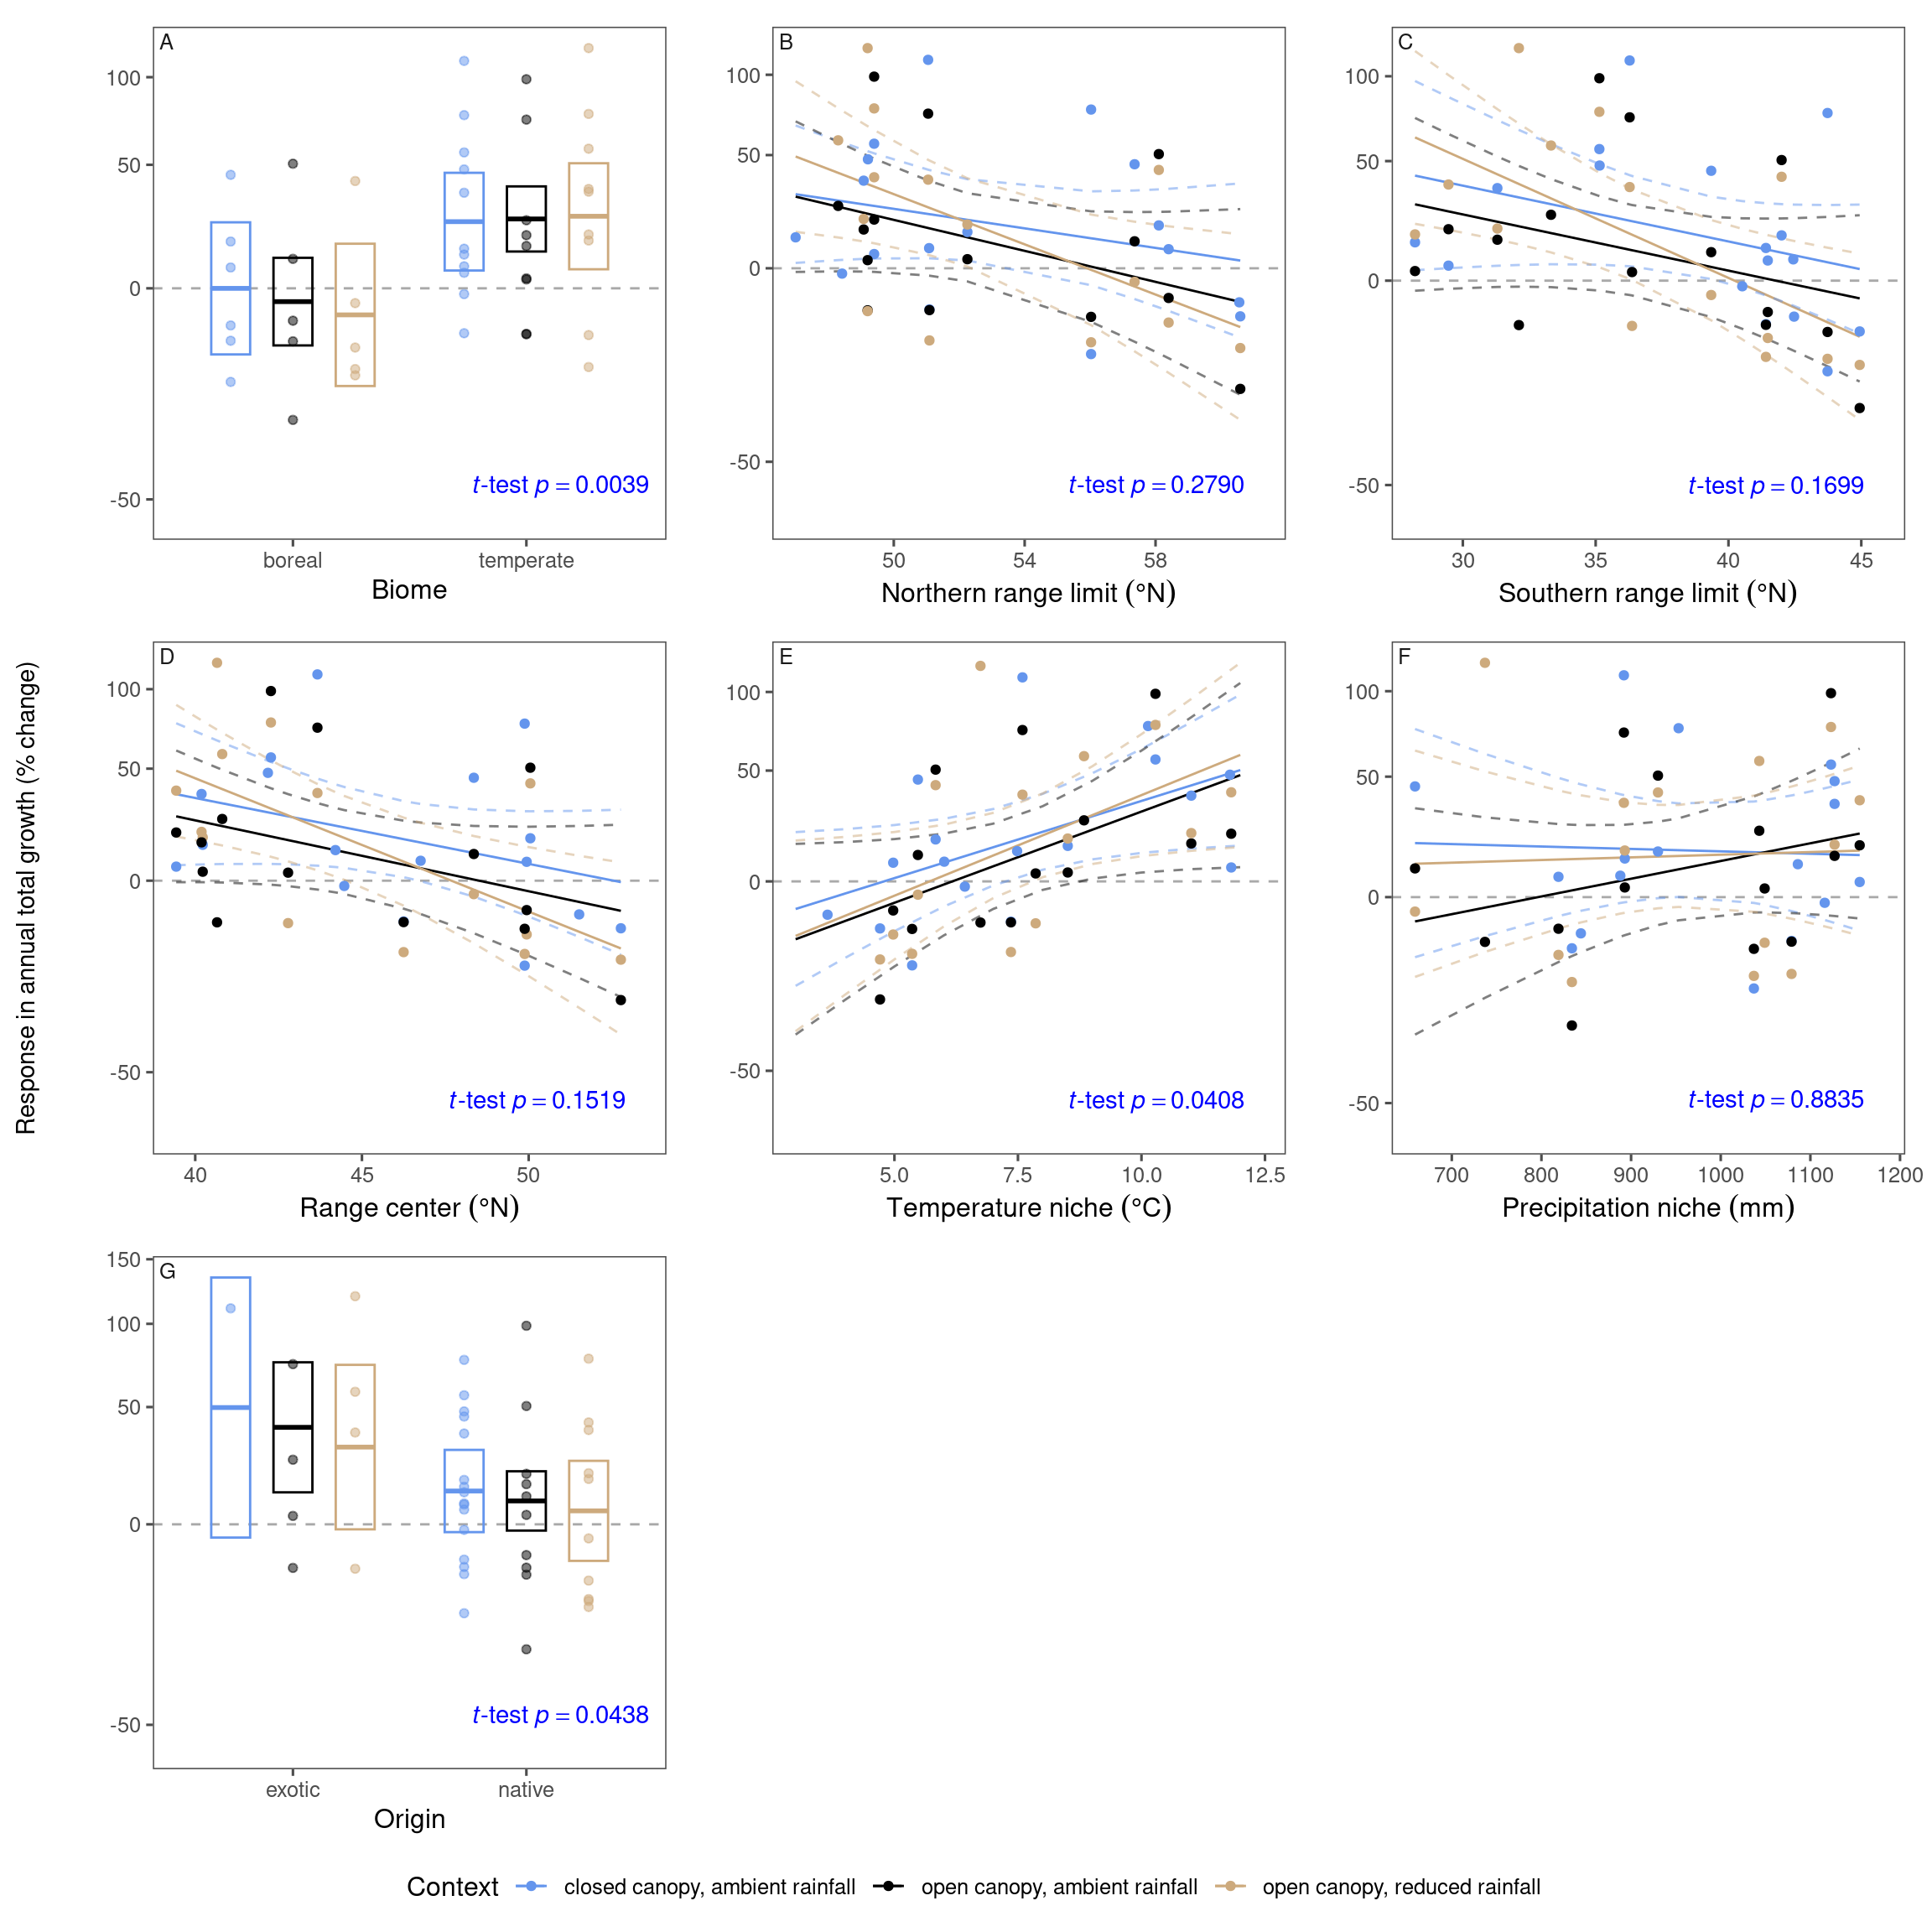
(B) annual total growth | |||
|---|---|---|---|
species | closed canopy, | open canopy, | open canopy, |
Picea mariana | -11.5 | ||
Picea glauca | -15.8 | -35.1 | -24.9 |
Pinus banksiana | 7.07 | -10.1 | -17.7 |
Abies balsamea | -26.5 | -16.0 | -23.3 |
Pinus resinosa | 7.48 | ||
Pinus strobus | -13.7 | -13.9 | -22.8 |
Tsuga canadensis | 11.7 | ||
Populus tremuloides | 45.1 | 10.1 | -4.75 |
Betula papyrifera | 16.6 | 50.5 | 42.2 |
Betula alleghaniensis | -1.89 | ||
Quercus macrocarpa | 13.9 | 3.31 | 17.0 |
Acer negundo | 76.6 | ||
Acer saccharum | 56.2 | 98.7 | 77.3 |
Quercus rubra | 36.9 | 14.9 | 19.3 |
Tilia americana | 47.7 | ||
Acer rubrum | 5.22 | 19.1 | 38.5 |
Lonicera tatarica | -14.0 | 120 | |
Rhamnus cathartica | 111 | 74.0 | 37.4 |
Frangula alnus | 2.95 | -14.2 | |
Lonicera morrowii | 25.0 | 58.1 | |
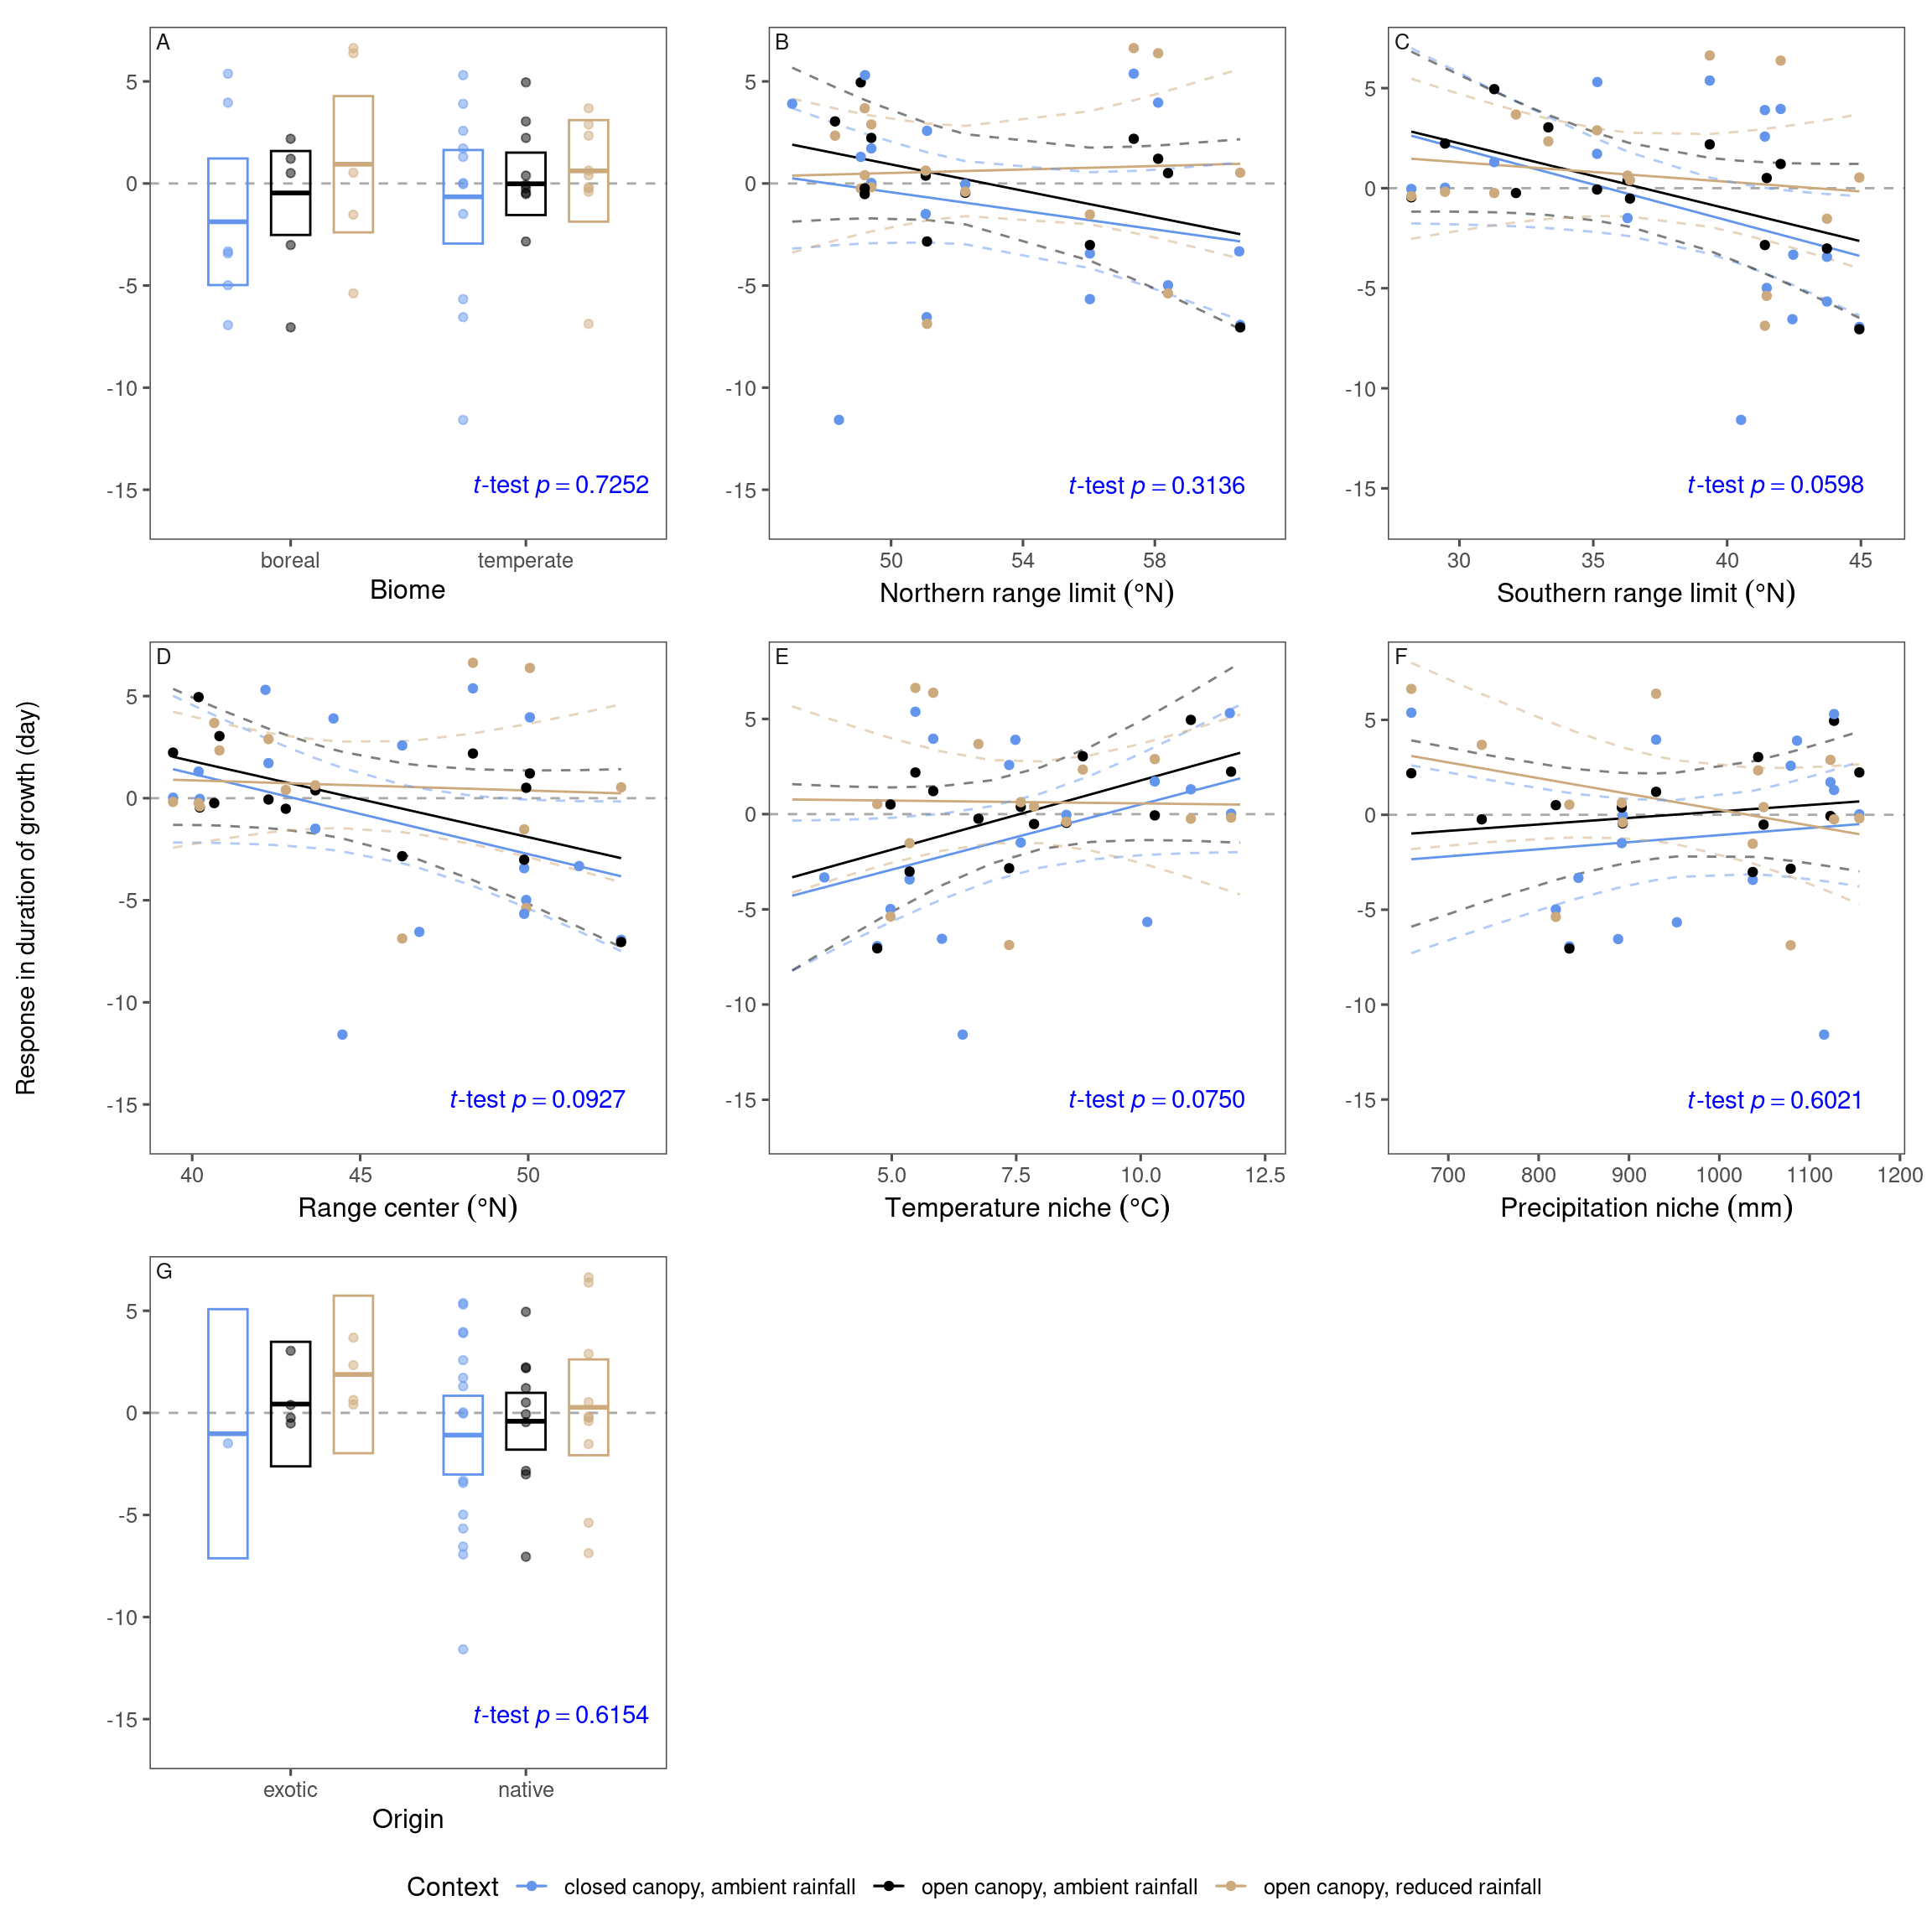
(C) duration of growth | |||
|---|---|---|---|
species | closed canopy, | open canopy, | open canopy, |
Picea mariana | -3.32 | ||
Picea glauca | -6.93 | -7.05 | 0.530 |
Pinus banksiana | -4.99 | 0.508 | -5.38 |
Abies balsamea | -3.43 | -3.01 | -1.53 |
Pinus resinosa | -6.55 | ||
Pinus strobus | 2.58 | -2.84 | -6.87 |
Tsuga canadensis | 3.90 | ||
Populus tremuloides | 5.38 | 2.19 | 6.63 |
Betula papyrifera | 3.96 | 1.21 | 6.38 |
Betula alleghaniensis | -11.6 | ||
Quercus macrocarpa | -0.0377 | -0.457 | -0.402 |
Acer negundo | -5.66 | ||
Acer saccharum | 1.72 | -0.0657 | 2.89 |
Quercus rubra | 1.30 | 4.95 | -0.242 |
Tilia americana | 5.31 | ||
Acer rubrum | 0.0230 | 2.23 | -0.182 |
Lonicera tatarica | -0.241 | 3.68 | |
Rhamnus cathartica | -1.49 | 0.385 | 0.629 |
Frangula alnus | -0.519 | 0.404 | |
Lonicera morrowii | 3.04 | 2.34 | |
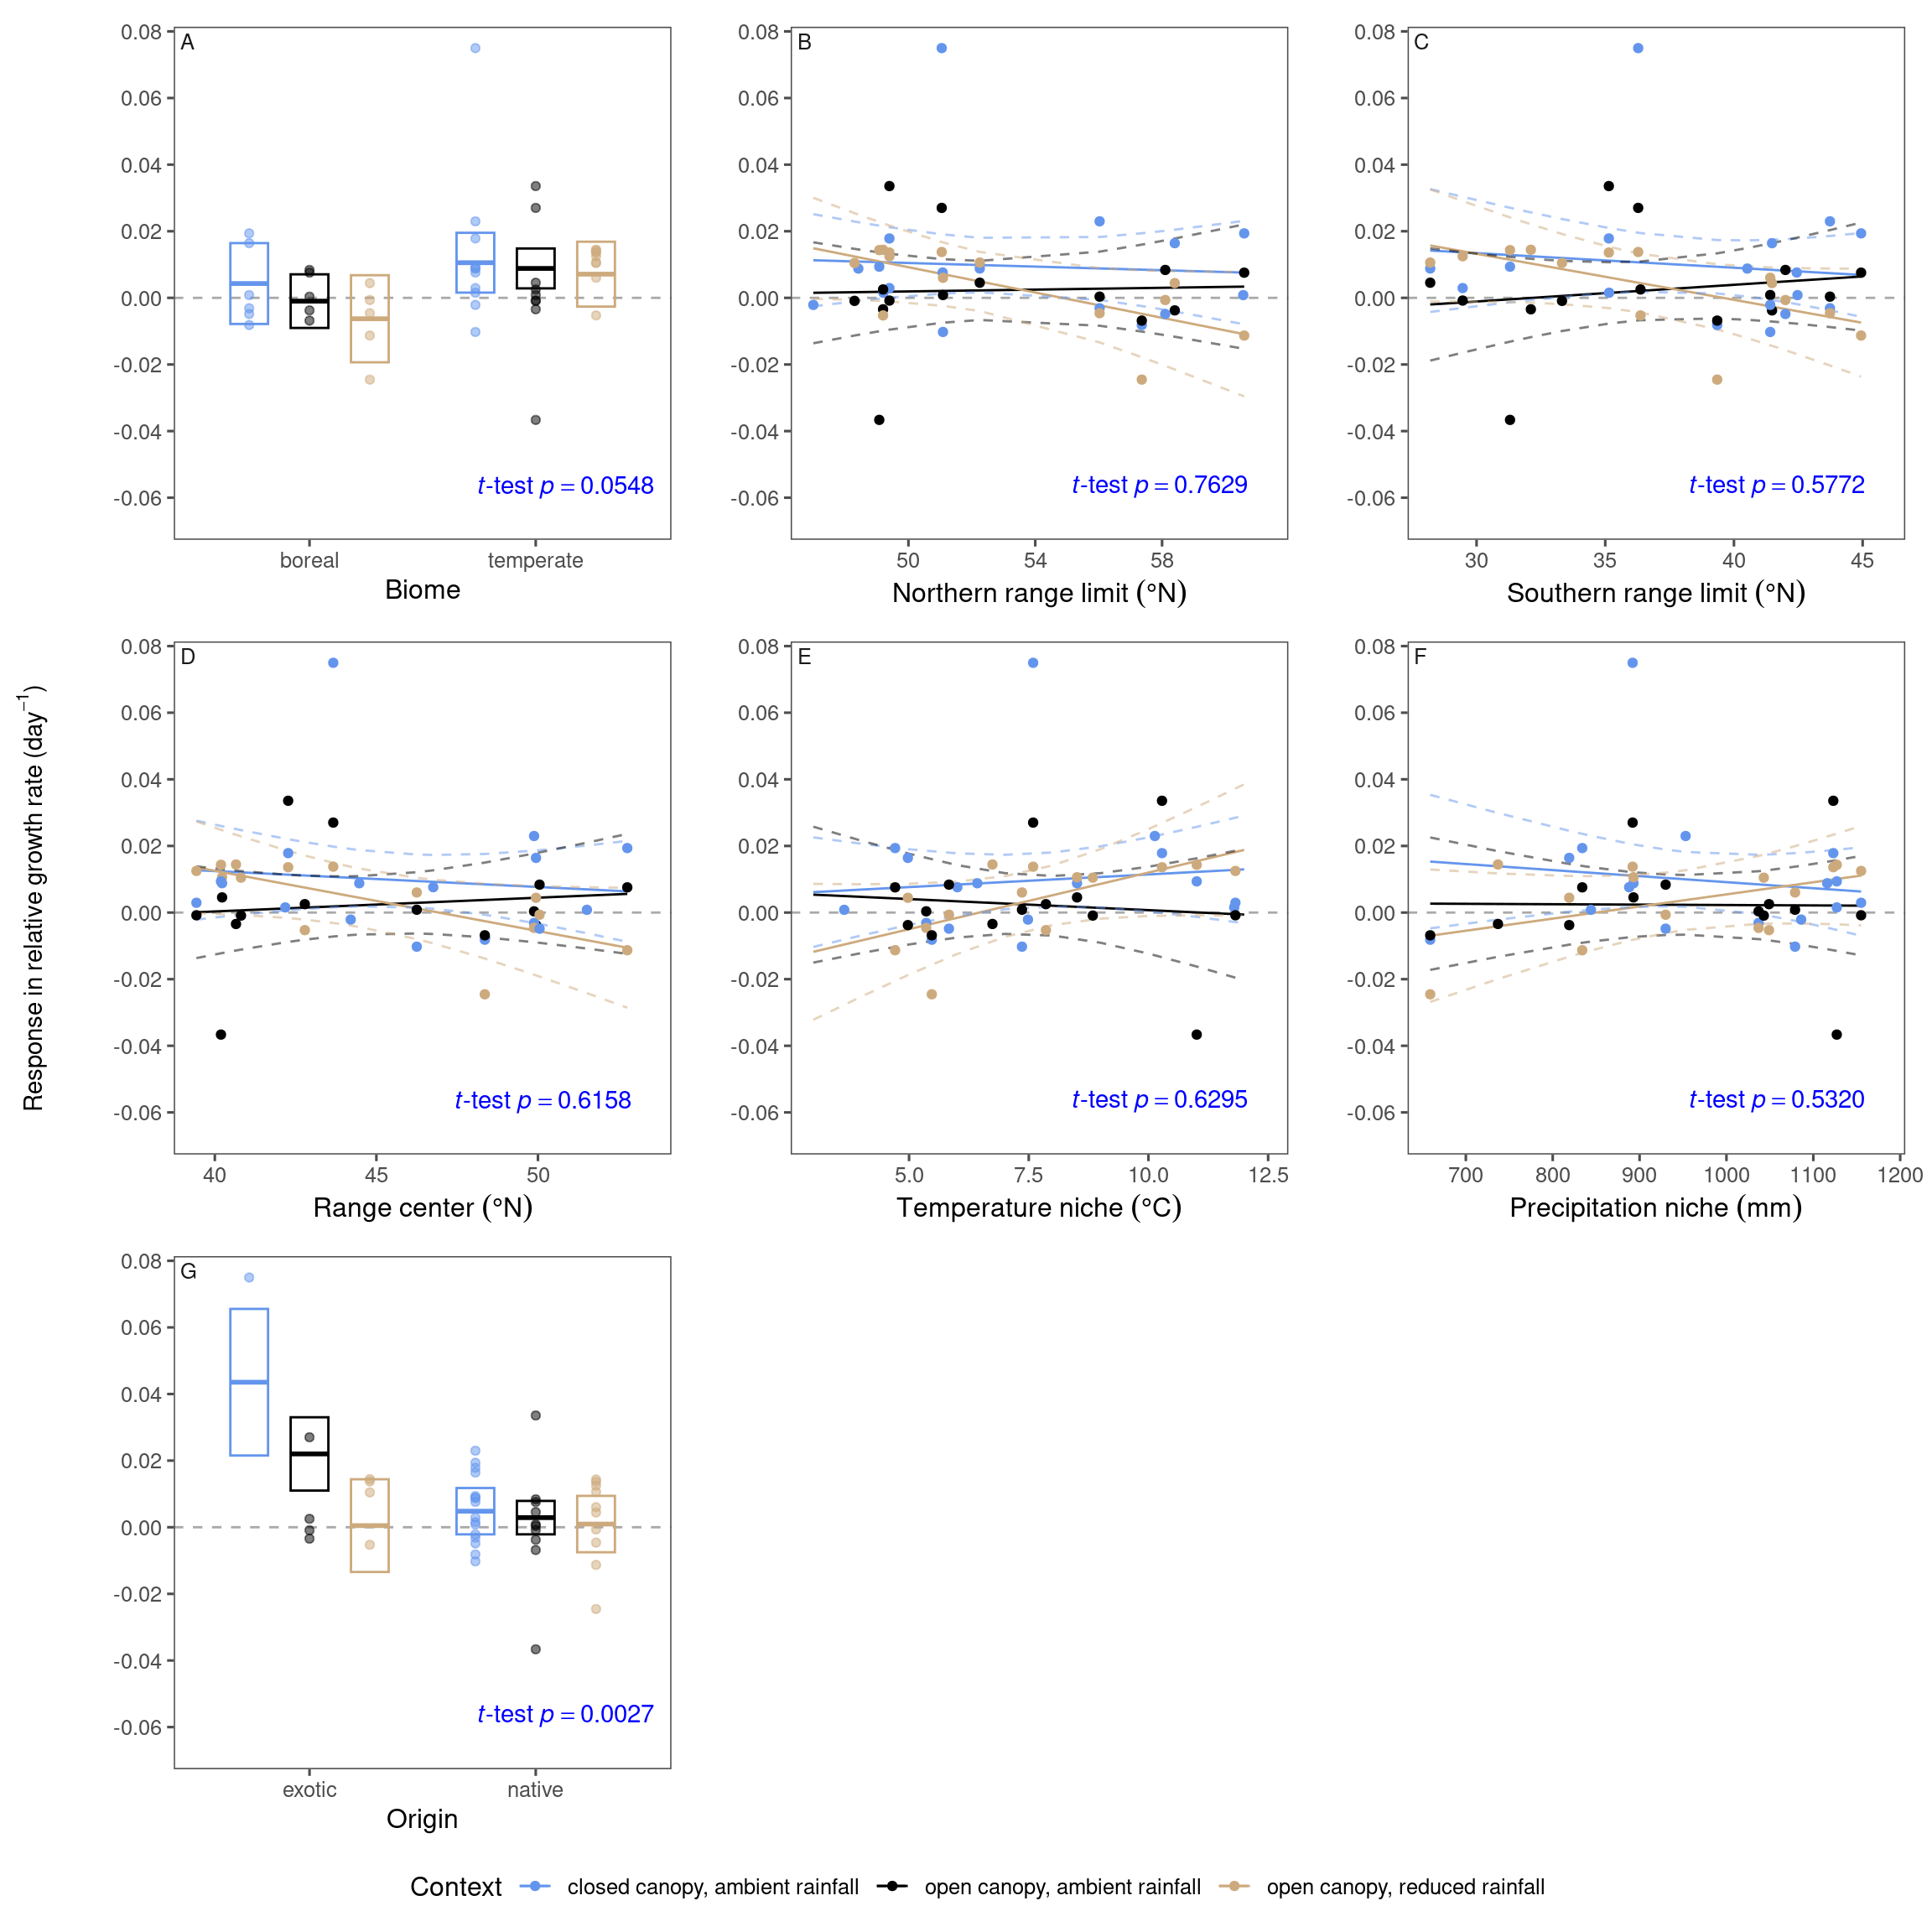
(D) relative growth rate | |||
|---|---|---|---|
species | closed canopy, | open canopy, | open canopy, |
Picea mariana | 0.000822 | ||
Picea glauca | 0.0194 | 0.00756 | -0.0113 |
Pinus banksiana | 0.0164 | -0.00376 | 0.00443 |
Abies balsamea | -0.00311 | 0.000366 | -0.00461 |
Pinus resinosa | 0.00761 | ||
Pinus strobus | -0.0102 | 0.000850 | 0.00603 |
Tsuga canadensis | -0.00211 | ||
Populus tremuloides | -0.00815 | -0.00683 | -0.0245 |
Betula papyrifera | -0.00484 | 0.00838 | -0.000650 |
Betula alleghaniensis | 0.00880 | ||
Quercus macrocarpa | 0.00881 | 0.00455 | 0.0106 |
Acer negundo | 0.0230 | ||
Acer saccharum | 0.0178 | 0.0336 | 0.0136 |
Quercus rubra | 0.00936 | -0.0366 | 0.0143 |
Tilia americana | 0.00154 | ||
Acer rubrum | 0.00293 | -0.000815 | 0.0125 |
Lonicera tatarica | -0.00343 | 0.0144 | |
Rhamnus cathartica | 0.0750 | 0.0270 | 0.0138 |
Frangula alnus | 0.00252 | -0.00528 | |
Lonicera morrowii | -0.000906 | 0.0105 | |
(A) start of growth | |
|---|---|
species type | effect size |
evergreen gymnosperm tree | -3.11 (-8.30, -0.108) |
deciduous angiosperm tree | -4.32 (-9.93, -0.109) |
exotic shrub | -6.40 (-9.44, -3.37) |
(B) annual total growth | |
|---|---|
species type | effect size |
evergreen gymnosperm tree | -15.8 (-32.1, 10.2) |
deciduous angiosperm tree | 19.3 (-3.32, 88.0) |
exotic shrub | 37.4 (-14.2, 118) |
(C) duration of growth | |
|---|---|
species type | effect size |
evergreen gymnosperm tree | -3.32 (-7.01, 3.44) |
deciduous angiosperm tree | 1.30 (-8.62, 6.50) |
exotic shrub | 0.404 (-1.30, 3.55) |
(D) relative growth rate | |
|---|---|
species type | effect size |
evergreen gymnosperm tree | 0.000822 (-0.0109, 0.0183) |
deciduous angiosperm tree | 0.00838 (-0.0306, 0.0283) |
exotic shrub | 0.0105 (-0.00491, 0.0654) |
(A) start of growth |
|---|
overall effect size |
-4.32 (-9.62, 0.102) |
(B) annual total growth |
|---|
overall effect size |
11.7 (-26.3, 110) |
(C) duration of growth |
|---|
overall effect size |
0.0230 (-7.04, 6.28) |
(D) relative growth rate |
|---|
overall effect size |
0.00443 (-0.0232, 0.0329) |
(A) start of growth | |
|---|---|
term | estimate |
intercept | -3.41 ± 1.40 (0.0202) |
deciduous angiosperm tree | -1.89 ± 1.81 (0.3029) |
exotic shrub | -2.69 ± 1.98 (0.1838) |
closed canopy | -0.348 ± 1.76 (0.8440) |
reduced rainfall | 0.200 ± 1.98 (0.9203) |
deciduous angiosperm tree:closed canopy | 1.40 ± 2.30 (0.5456) |
exotic shrub:closed canopy | 0.0401 ± 3.59 (0.9912) |
deciduous angiosperm tree:reduced rainfall | -0.208 ± 2.56 (0.9358) |
exotic shrub:reduced rainfall | -0.599 ± 2.80 (0.8320) |
(B) annual total growth | |
|---|---|
term | estimate |
intercept | -0.216 ± 0.111 (0.0609) |
deciduous angiosperm tree | 0.472 ± 0.144 (0.0023) |
exotic shrub | 0.380 ± 0.158 (0.0213) |
closed canopy | 0.144 ± 0.140 (0.3079) |
reduced rainfall | -0.0354 ± 0.158 (0.8237) |
deciduous angiosperm tree:closed canopy | -0.133 ± 0.182 (0.4696) |
exotic shrub:closed canopy | 0.438 ± 0.286 (0.1338) |
deciduous angiosperm tree:reduced rainfall | 0.0350 ± 0.203 (0.8643) |
exotic shrub:reduced rainfall | 0.224 ± 0.223 (0.3212) |
(C) duration of growth | |
|---|---|
term | estimate |
intercept | -3.10 ± 1.88 (0.1074) |
deciduous angiosperm tree | 4.77 ± 2.42 (0.0565) |
exotic shrub | 3.76 ± 2.65 (0.1646) |
closed canopy | 0.422 ± 2.35 (0.8587) |
reduced rainfall | -0.215 ± 2.65 (0.9360) |
deciduous angiosperm tree:closed canopy | -2.05 ± 3.07 (0.5084) |
exotic shrub:closed canopy | -2.58 ± 4.81 (0.5946) |
deciduous angiosperm tree:reduced rainfall | 1.05 ± 3.43 (0.7609) |
exotic shrub:reduced rainfall | 1.31 ± 3.75 (0.7286) |
(D) relative growth rate | |
|---|---|
term | estimate |
intercept | 0.00125 ± 0.00665 (0.8515) |
deciduous angiosperm tree | -0.000887 ± 0.00859 (0.9183) |
exotic shrub | 0.00504 ± 0.00941 (0.5951) |
closed canopy | 0.00285 ± 0.00834 (0.7344) |
reduced rainfall | -0.00262 ± 0.00941 (0.7823) |
deciduous angiosperm tree:closed canopy | 0.00337 ± 0.0109 (0.7590) |
exotic shrub:closed canopy | 0.0658 ± 0.0171 (0.0005) |
deciduous angiosperm tree:reduced rainfall | 0.00656 ± 0.0121 (0.5925) |
exotic shrub:reduced rainfall | 0.00467 ± 0.0133 (0.7275) |
## # A tibble: 11 × 4
## # Groups:   species [11]
##    scientific_name     species estimate p.value
##    <fct>               <fct>      <dbl>   <dbl>
##  1 Pinus banksiana     pinba     -3.61    0.206
##  2 Rhamnus cathartica  rhaca     -1.65    0.525
##  3 Pinus strobus       pinst     -1.45    0.419
##  4 Populus tremuloides poptr     -0.718   0.493
##  5 Picea glauca        picgl     -0.674   0.706
##  6 Abies balsamea      abiba     -0.423   0.626
##  7 Quercus rubra       queru      0.323   0.820
##  8 Quercus macrocarpa  quema      0.372   0.626
##  9 Acer saccharum      acesa      1.23    0.754
## 10 Acer rubrum         aceru      1.55    0.290
## 11 Betula papyrifera   betpa      1.84    0.690
Other parameters
Baseline in ambient plots
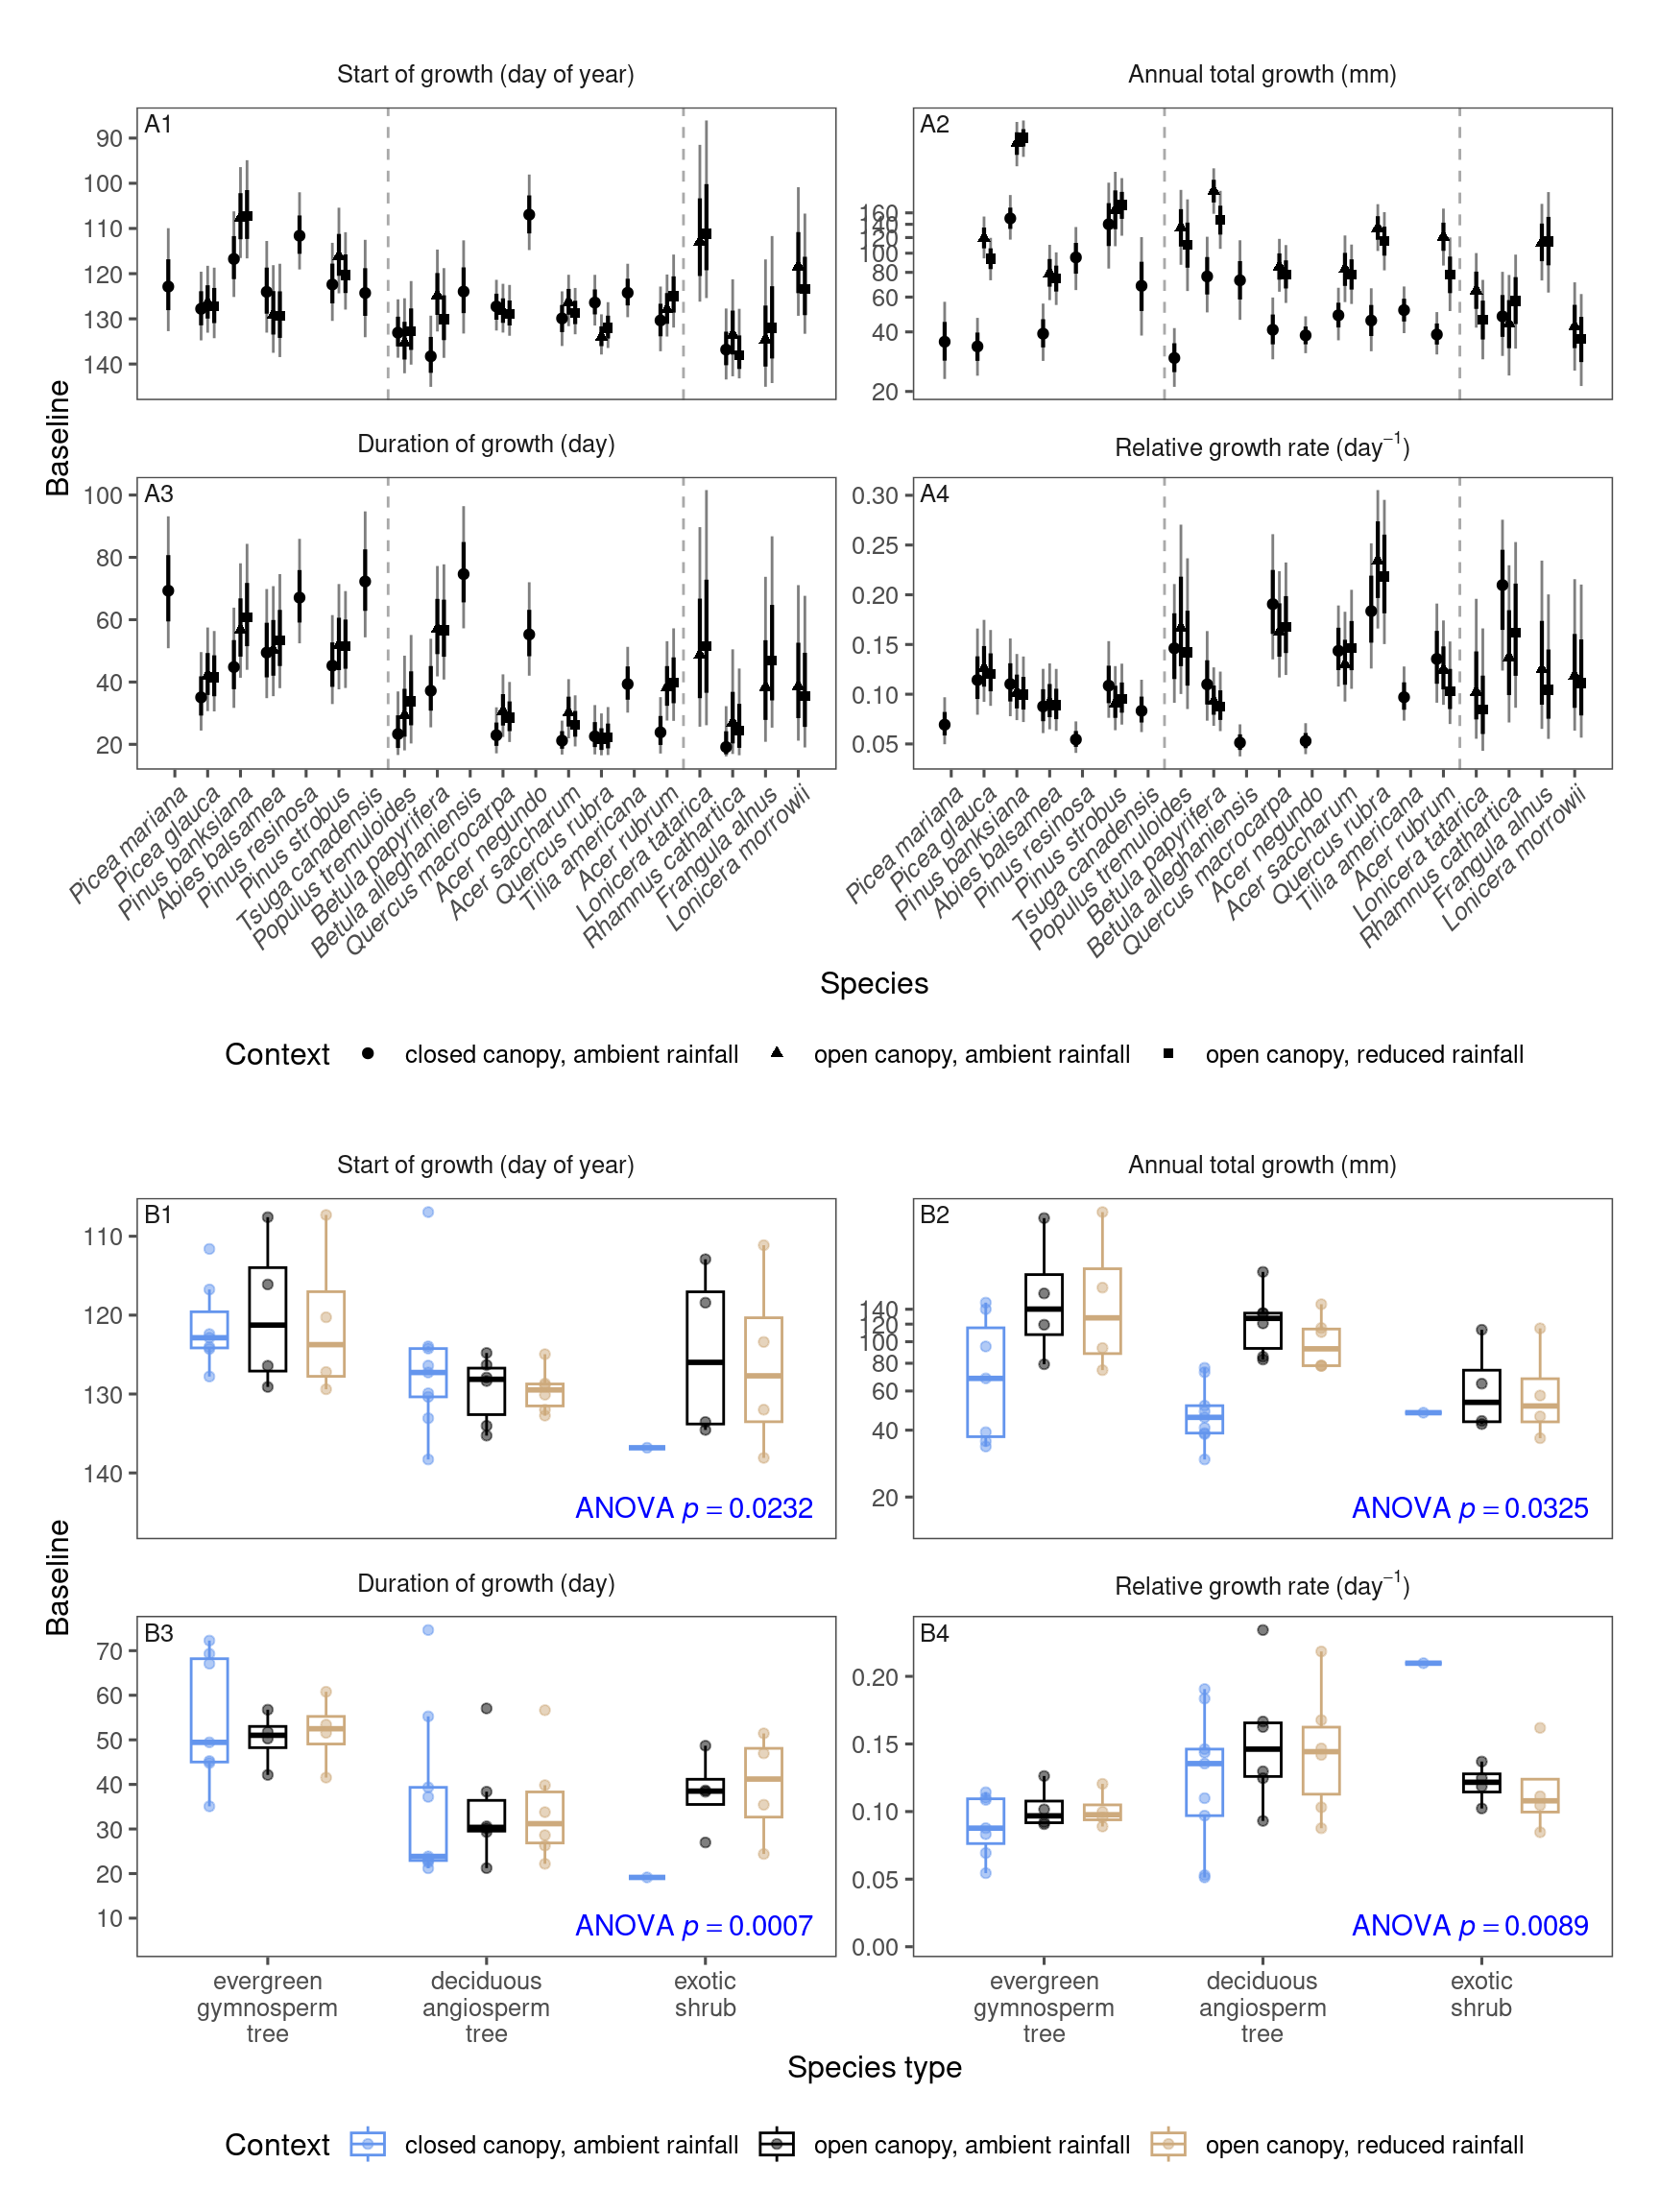
(A) start of growth | |||
|---|---|---|---|
species | closed canopy, | open canopy, | open canopy, |
Picea mariana | 123 | ||
Picea glauca | 128 | 126 | 127 |
Pinus banksiana | 117 | 108 | 107 |
Abies balsamea | 124 | 129 | 129 |
Pinus resinosa | 112 | ||
Pinus strobus | 122 | 116 | 120 |
Tsuga canadensis | 124 | ||
Populus tremuloides | 133 | 135 | 133 |
Betula papyrifera | 138 | 125 | 130 |
Betula alleghaniensis | 124 | ||
Quercus macrocarpa | 127 | 128 | 129 |
Acer negundo | 107 | ||
Acer saccharum | 130 | 126 | 129 |
Quercus rubra | 126 | 134 | 132 |
Tilia americana | 124 | ||
Acer rubrum | 130 | 128 | 125 |
Lonicera tatarica | 113 | 111 | |
Rhamnus cathartica | 137 | 134 | 138 |
Frangula alnus | 135 | 132 | |
Lonicera morrowii | 118 | 123 | |
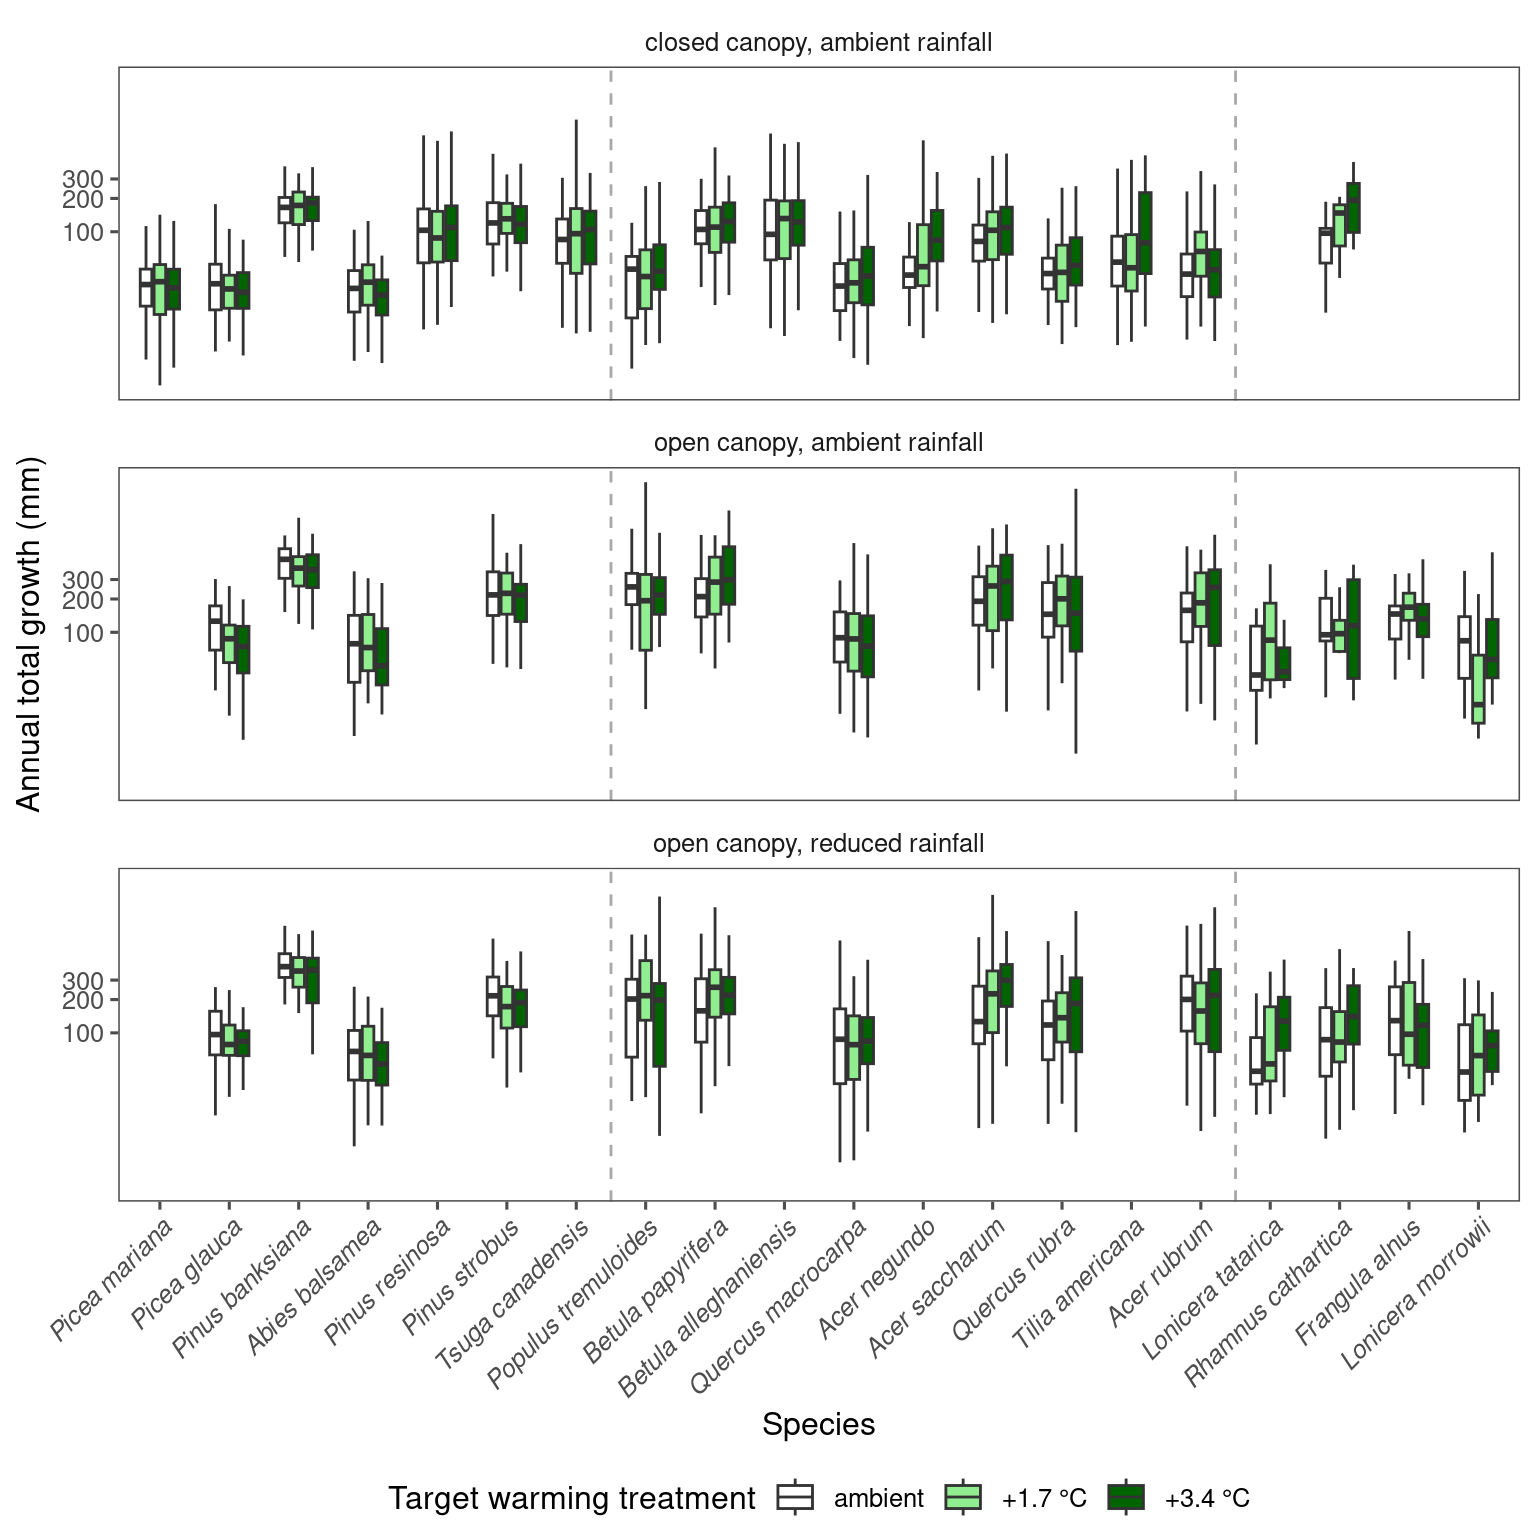
(B) annual total growth | |||
|---|---|---|---|
species | closed canopy, | open canopy, | open canopy, |
Picea mariana | 35.7 | ||
Picea glauca | 33.8 | 119 | 93.6 |
Pinus banksiana | 150 | 360 | 383 |
Abies balsamea | 39.2 | 79.2 | 74.5 |
Pinus resinosa | 95.2 | ||
Pinus strobus | 140 | 165 | 175 |
Tsuga canadensis | 68.4 | ||
Populus tremuloides | 29.5 | 135 | 110 |
Betula papyrifera | 76.3 | 206 | 147 |
Betula alleghaniensis | 72.9 | ||
Quercus macrocarpa | 41.0 | 85.6 | 78.1 |
Acer negundo | 38.4 | ||
Acer saccharum | 48.5 | 83.1 | 77.8 |
Quercus rubra | 45.7 | 134 | 115 |
Tilia americana | 51.5 | ||
Acer rubrum | 38.8 | 121 | 77.9 |
Lonicera tatarica | 64.7 | 46.1 | |
Rhamnus cathartica | 47.9 | 44.0 | 57.3 |
Frangula alnus | 113 | 115 | |
Lonicera morrowii | 42.6 | 36.8 | |
(C) duration of growth | |||
|---|---|---|---|
species | closed canopy, | open canopy, | open canopy, |
Picea mariana | 69.3 | ||
Picea glauca | 35.1 | 42.1 | 41.5 |
Pinus banksiana | 44.8 | 56.8 | 60.8 |
Abies balsamea | 49.4 | 50.3 | 53.4 |
Pinus resinosa | 67.1 | ||
Pinus strobus | 45.2 | 51.8 | 51.6 |
Tsuga canadensis | 72.3 | ||
Populus tremuloides | 23.3 | 29.3 | 33.8 |
Betula papyrifera | 37.2 | 57.0 | 56.6 |
Betula alleghaniensis | 74.6 | ||
Quercus macrocarpa | 22.9 | 30.6 | 28.6 |
Acer negundo | 55.3 | ||
Acer saccharum | 21.2 | 30.1 | 26.3 |
Quercus rubra | 22.6 | 21.2 | 22.2 |
Tilia americana | 39.3 | ||
Acer rubrum | 23.8 | 38.4 | 39.8 |
Lonicera tatarica | 48.7 | 51.4 | |
Rhamnus cathartica | 19.1 | 27.0 | 24.4 |
Frangula alnus | 38.3 | 47.0 | |
Lonicera morrowii | 38.6 | 35.4 | |
(D) relative growth rate | |||
|---|---|---|---|
species | closed canopy, | open canopy, | open canopy, |
Picea mariana | 0.0693 | ||
Picea glauca | 0.114 | 0.126 | 0.120 |
Pinus banksiana | 0.110 | 0.102 | 0.0998 |
Abies balsamea | 0.0877 | 0.0921 | 0.0890 |
Pinus resinosa | 0.0544 | ||
Pinus strobus | 0.109 | 0.0907 | 0.0955 |
Tsuga canadensis | 0.0833 | ||
Populus tremuloides | 0.146 | 0.167 | 0.142 |
Betula papyrifera | 0.110 | 0.0931 | 0.0876 |
Betula alleghaniensis | 0.0513 | ||
Quercus macrocarpa | 0.191 | 0.163 | 0.168 |
Acer negundo | 0.0529 | ||
Acer saccharum | 0.144 | 0.130 | 0.147 |
Quercus rubra | 0.184 | 0.234 | 0.218 |
Tilia americana | 0.0970 | ||
Acer rubrum | 0.135 | 0.125 | 0.103 |
Lonicera tatarica | 0.102 | 0.0847 | |
Rhamnus cathartica | 0.210 | 0.137 | 0.162 |
Frangula alnus | 0.125 | 0.105 | |
Lonicera morrowii | 0.119 | 0.111 | |
Implications
Growth rank
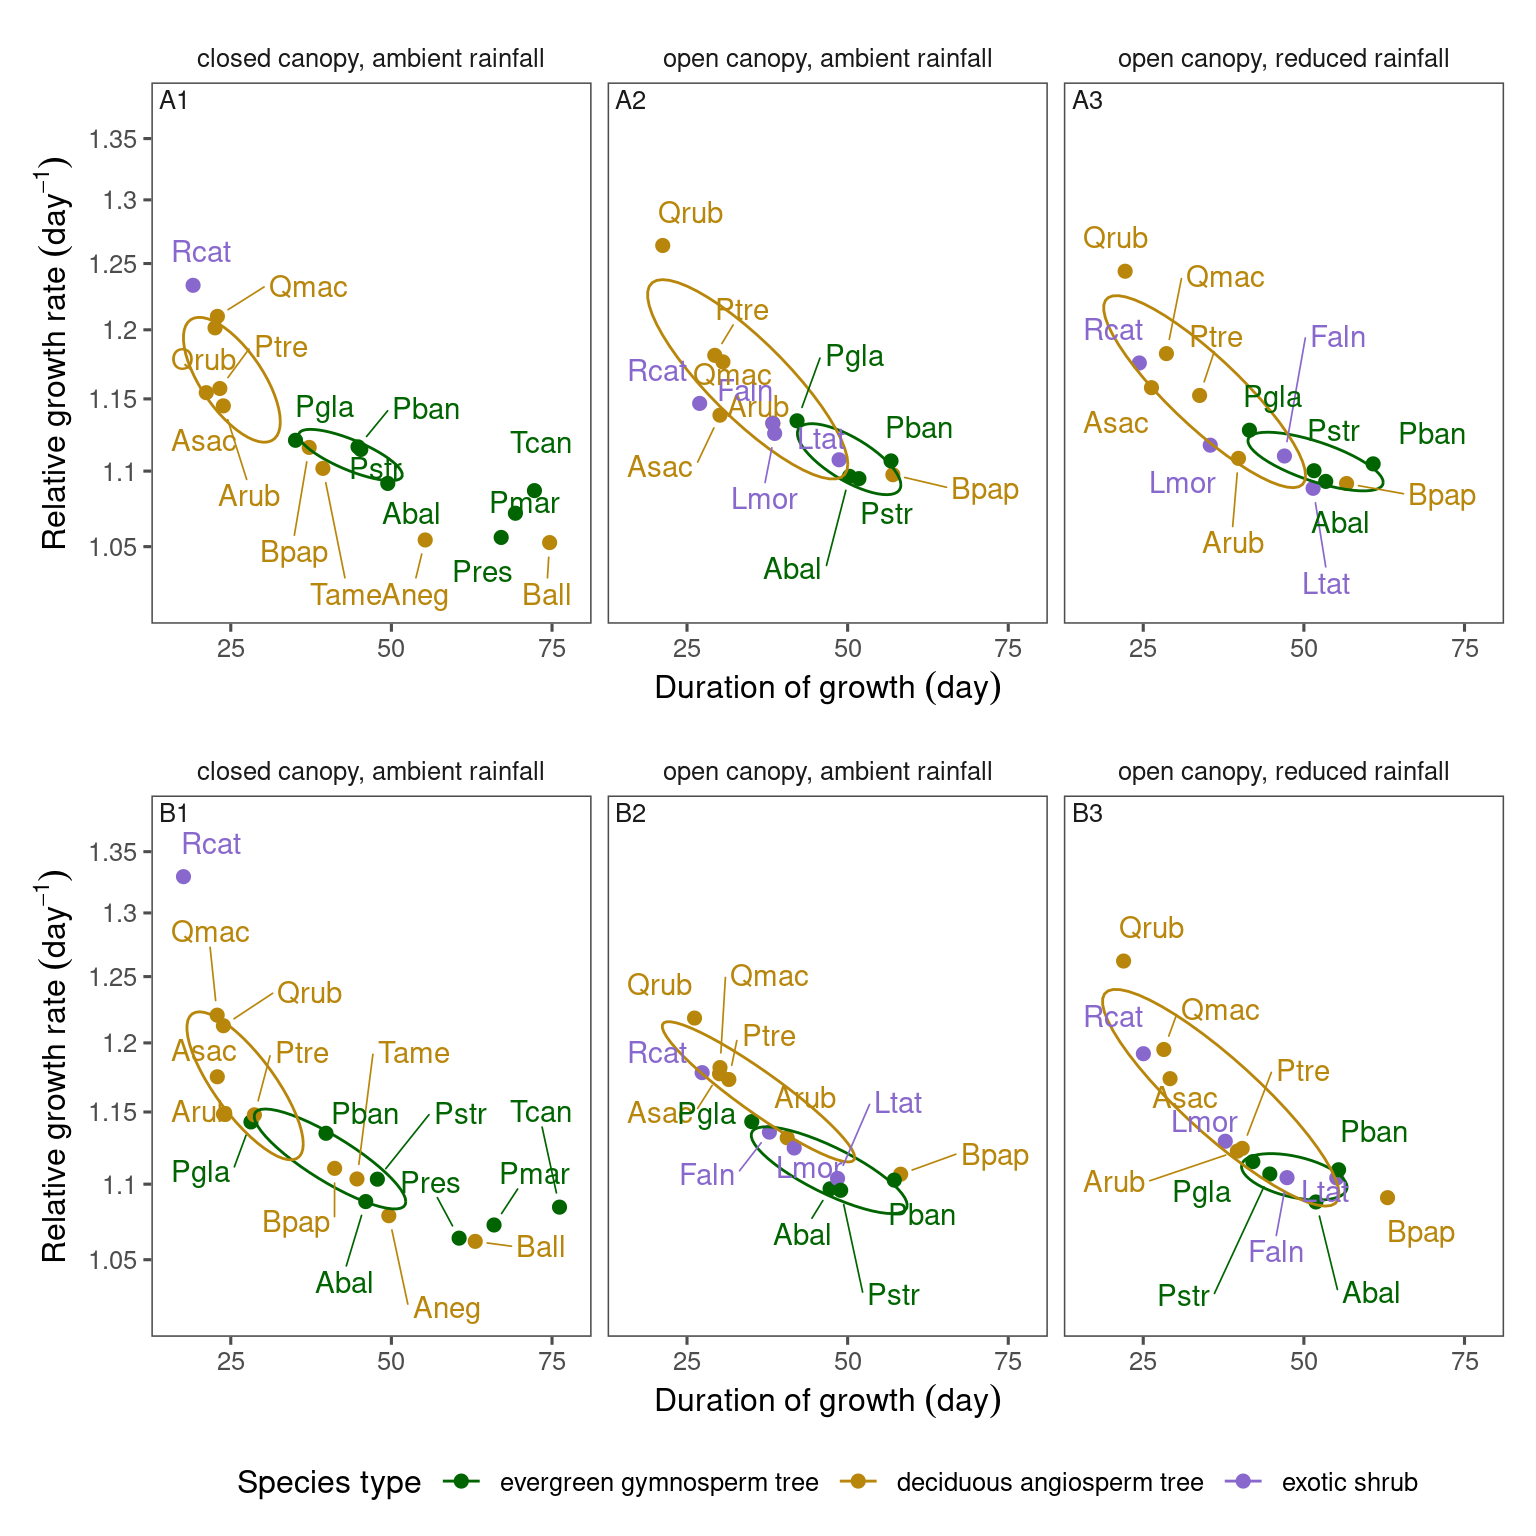
Duration vs speed
Trait
Correlation
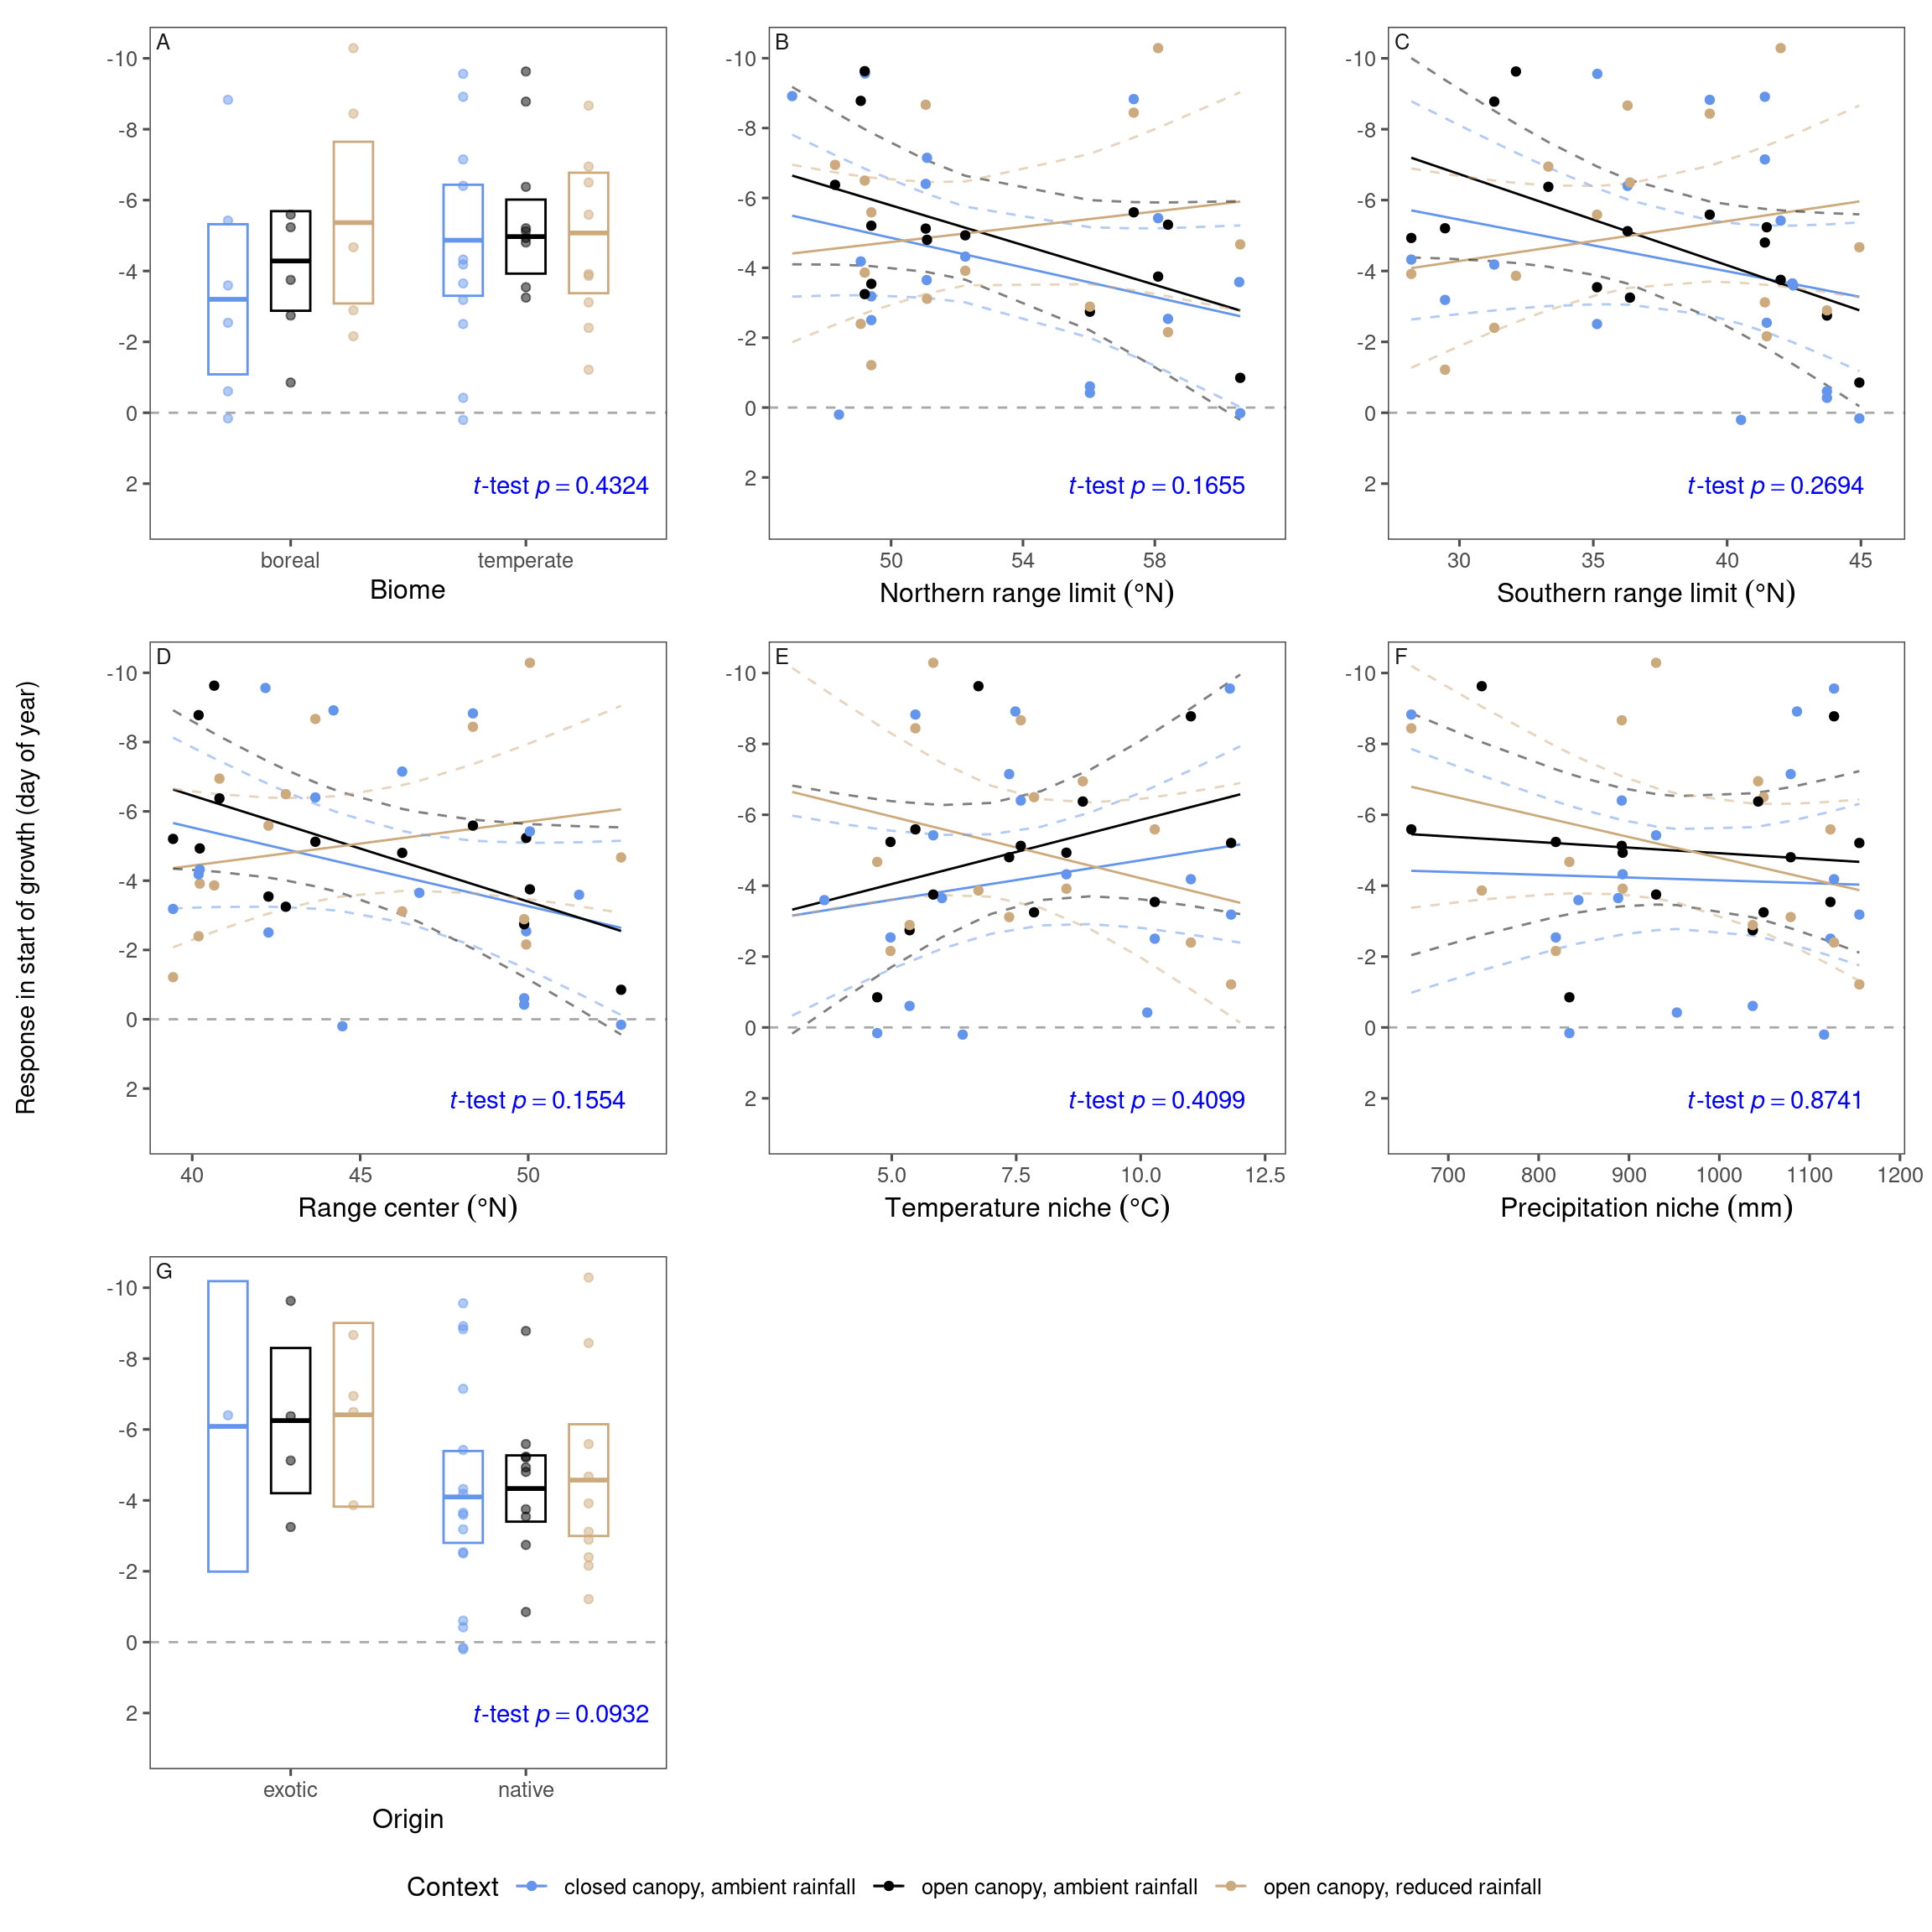
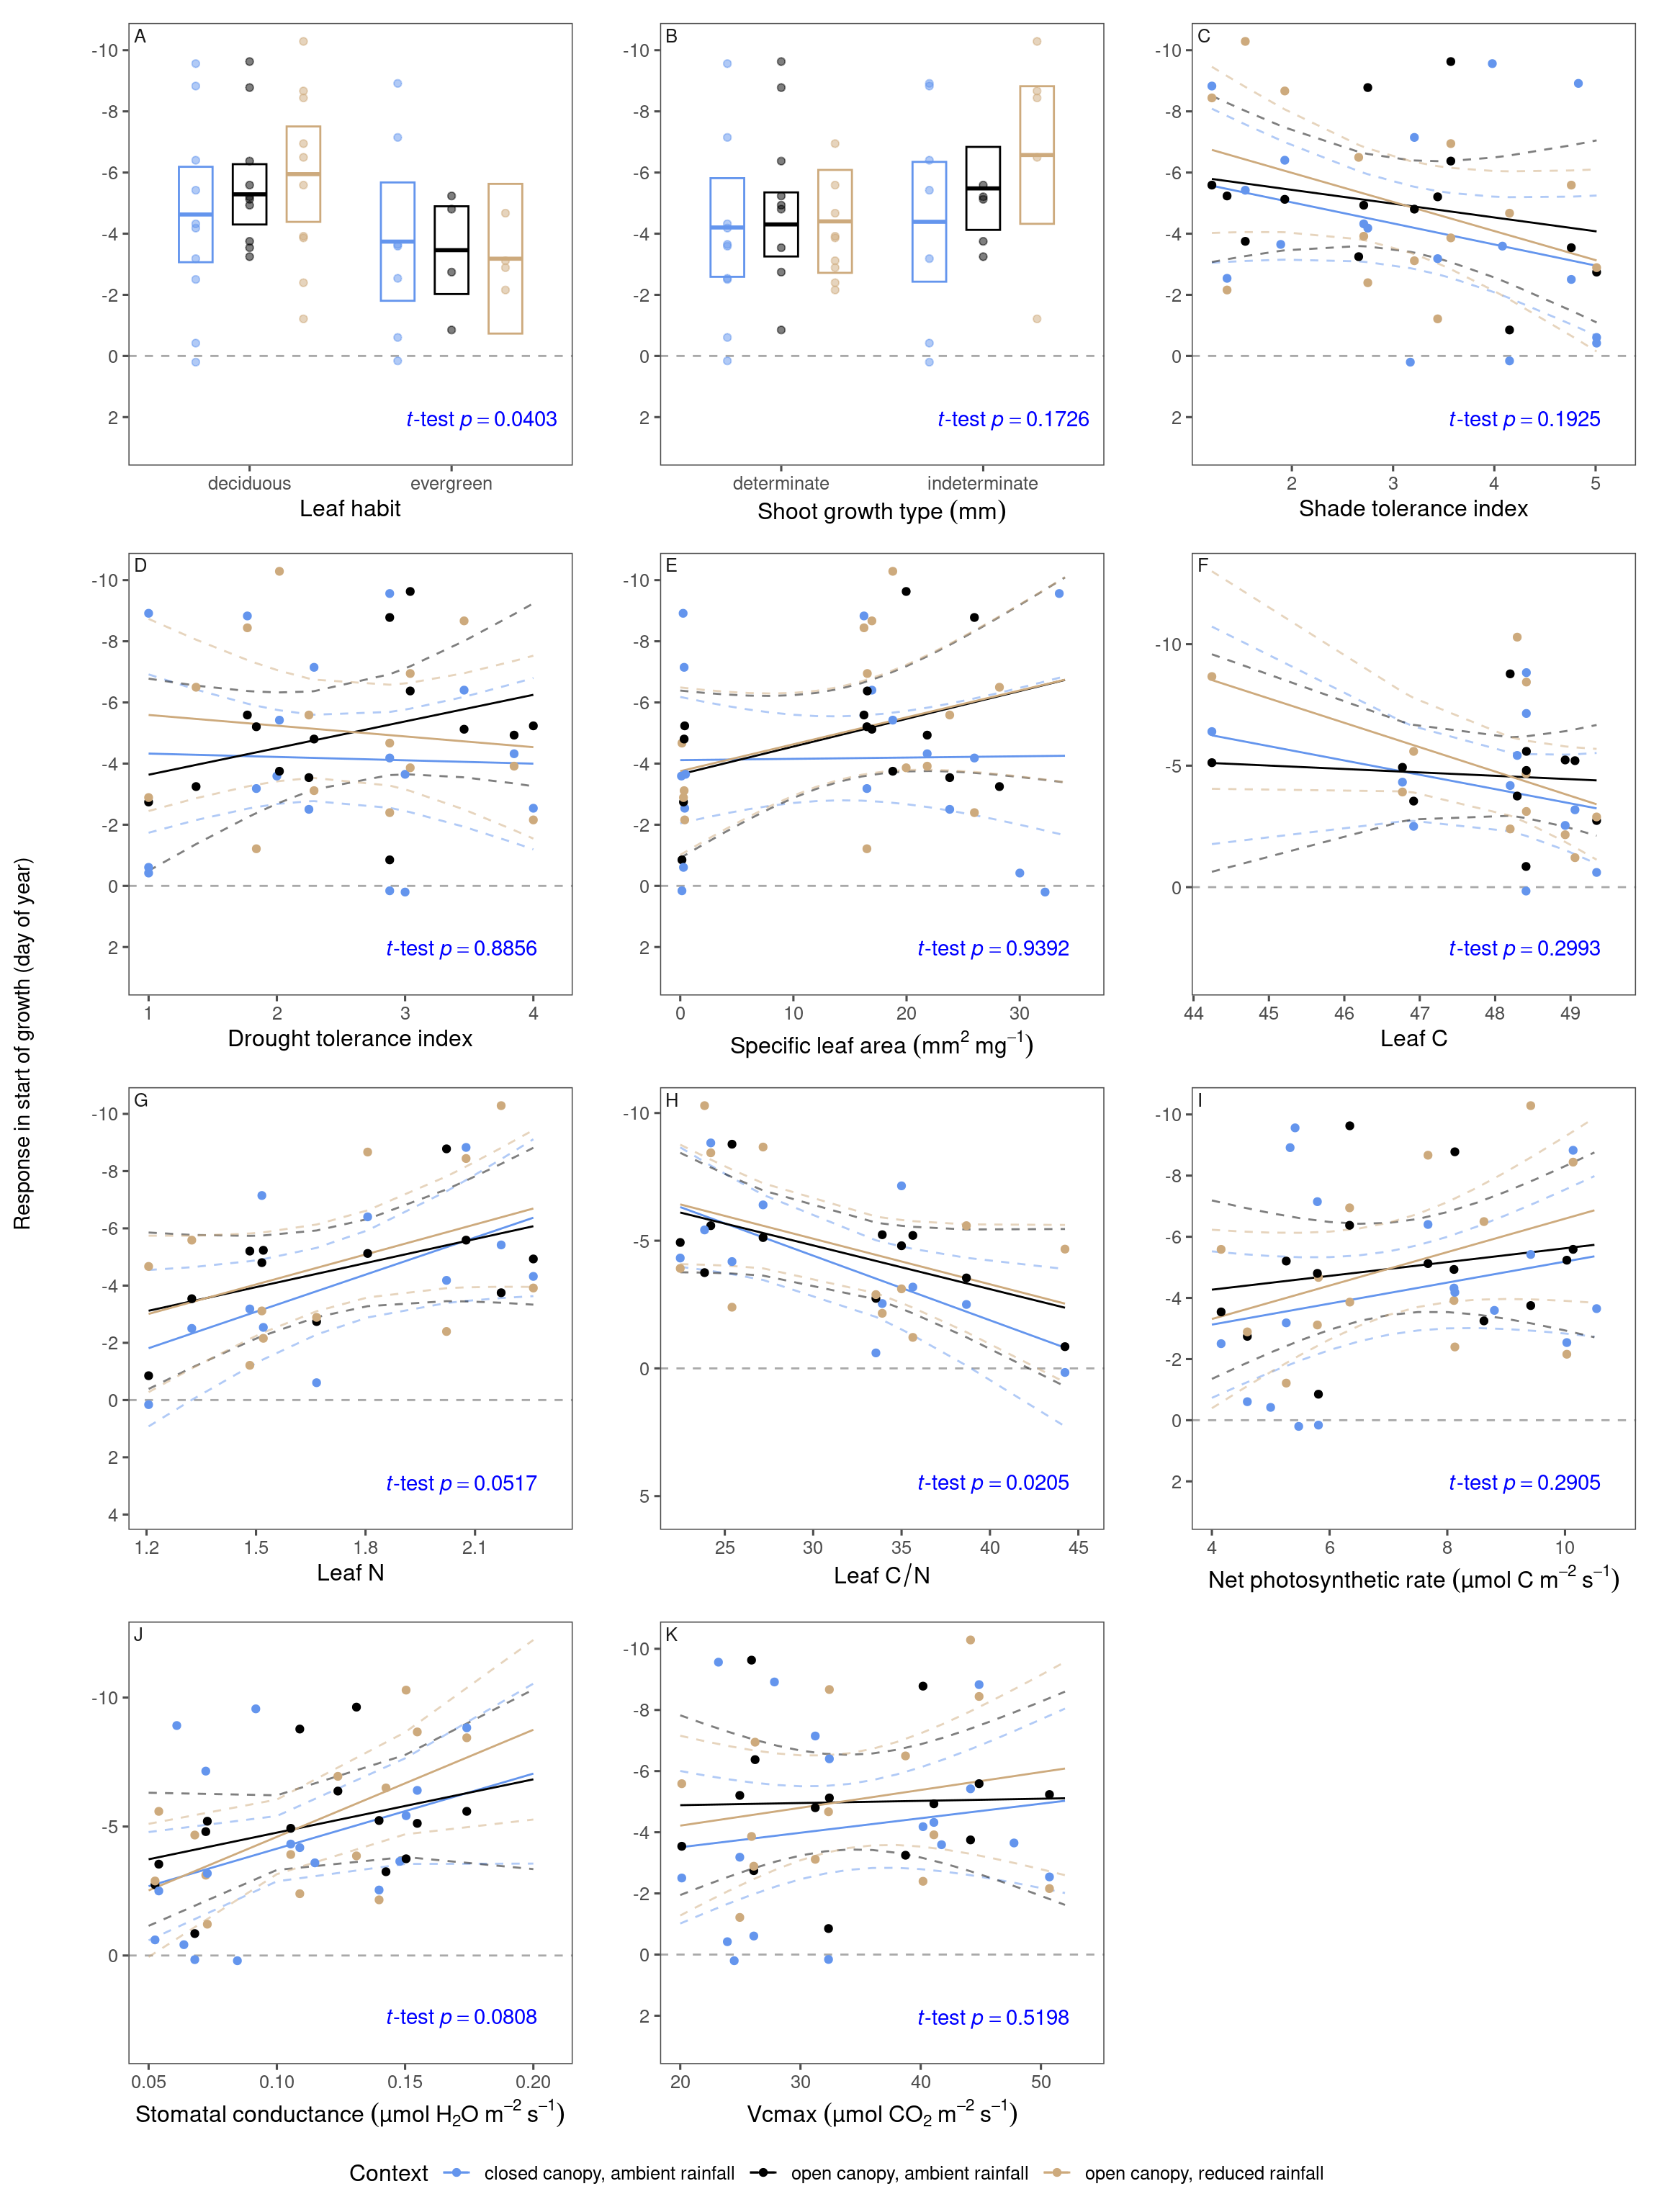
(A) start of growth | ||||
|---|---|---|---|---|
lifestyle predictor | intercept | lifestyle effect | context effect | interaction |
biome | -4.28 ± 0.696 | -0.687 ± 0.867 | -1.08 ± 0.839 | 0.979 ± 1.04 |
northern range limit | -4.75 ± 0.405 | 0.526 ± 0.412 | -0.414 ± 0.488 | -0.648 ± 0.491 |
southern range limit | -4.81 ± 0.411 | 0.505 ± 0.416 | -0.318 ± 0.496 | -0.672 ± 0.503 |
range center | -4.79 ± 0.403 | 0.594 ± 0.407 | -0.337 ± 0.486 | -0.777 ± 0.495 |
temperature niche | -4.73 ± 0.414 | -0.142 ± 0.426 | -0.446 ± 0.499 | 0.606 ± 0.501 |
precipitation niche | -4.71 ± 0.417 | 0.413 ± 0.420 | -0.428 ± 0.502 | 0.367 ± 0.512 |
origin | -6.25 ± 1.01 | 1.92 ± 1.12 | -0.164 ± 1.36 | -0.0737 ± 1.47 |
leaf habit | -5.29 ± 0.489 | 1.83 ± 0.862 | -0.660 ± 0.598 | 0.939 ± 1.02 |
shoot growth type | -4.30 ± 0.519 | -1.18 ± 0.849 | -0.0998 ± 0.630 | -0.992 ± 1.02 |
shade tolerance index | -4.71 ± 0.403 | 0.877 ± 0.412 | -0.361 ± 0.486 | 0.127 ± 0.488 |
drought tolerance index | -4.73 ± 0.424 | -0.100 ± 0.430 | -0.440 ± 0.510 | 0.0740 ± 0.514 |
specific leaf area | -4.71 ± 0.411 | -0.642 ± 0.432 | -0.432 ± 0.495 | -0.501 ± 0.499 |
leaf C | -4.51 ± 0.437 | 0.812 ± 0.444 | -0.380 ± 0.535 | 0.291 ± 0.544 |
leaf N | -4.51 ± 0.405 | -1.23 ± 0.412 | -0.380 ± 0.496 | 0.144 ± 0.504 |
leaf C/N | -4.51 ± 0.388 | 1.38 ± 0.394 | -0.380 ± 0.475 | -0.255 ± 0.482 |
net photosynthetic rate | -4.72 ± 0.407 | -0.764 ± 0.416 | -0.424 ± 0.490 | -0.175 ± 0.493 |
stomatal conductance | -4.70 ± 0.381 | -1.22 ± 0.385 | -0.301 ± 0.459 | -0.221 ± 0.465 |
Vcmax | -4.73 ± 0.420 | -0.361 ± 0.427 | -0.443 ± 0.505 | -0.0268 ± 0.508 |
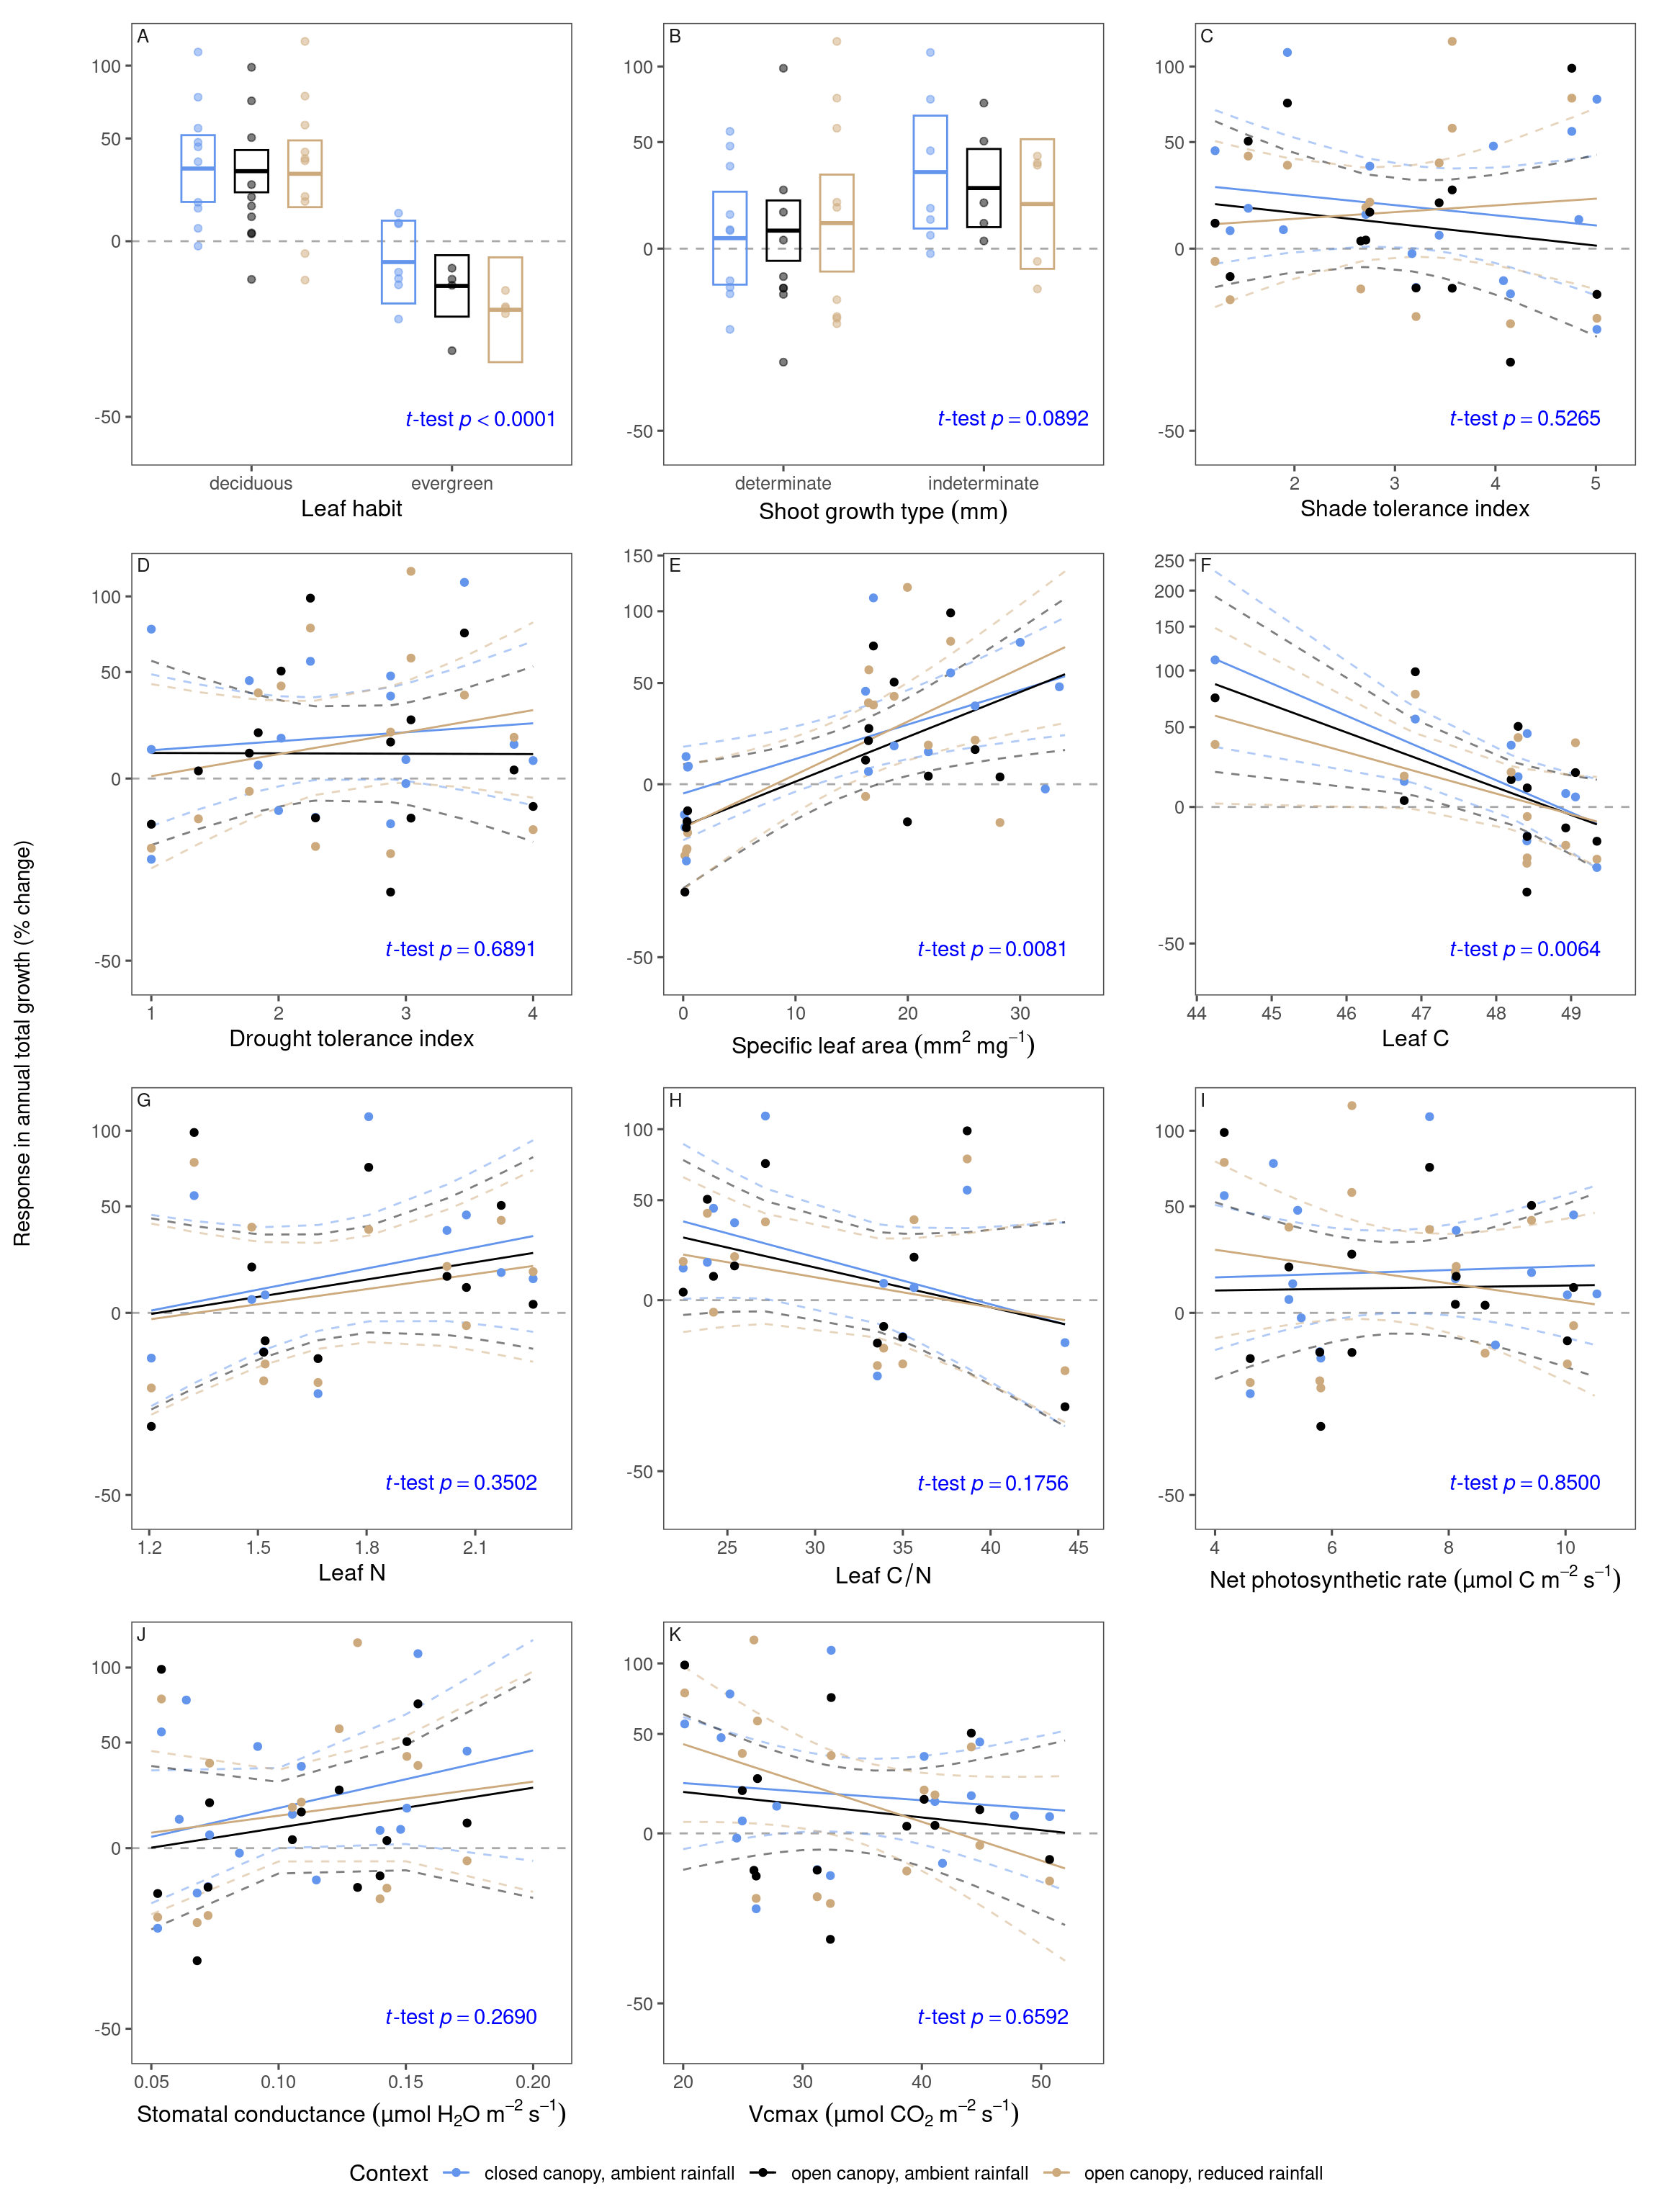
(B) annual total growth | ||||
|---|---|---|---|---|
lifestyle predictor | intercept | lifestyle effect | context effect | interaction |
biome | -0.0437 ± 0.0712 | 0.271 ± 0.0888 | -0.0435 ± 0.0859 | 0.0524 ± 0.107 |
northern range limit | 0.129 ± 0.0425 | -0.129 ± 0.0432 | -0.0160 ± 0.0512 | -0.0591 ± 0.0515 |
southern range limit | 0.122 ± 0.0422 | -0.137 ± 0.0427 | -0.0334 ± 0.0510 | -0.0600 ± 0.0516 |
range center | 0.125 ± 0.0415 | -0.142 ± 0.0419 | -0.0281 ± 0.0501 | -0.0561 ± 0.0509 |
temperature niche | 0.131 ± 0.0408 | 0.154 ± 0.0420 | -0.0117 ± 0.0492 | 0.0206 ± 0.0494 |
precipitation niche | 0.132 ± 0.0469 | 0.0299 ± 0.0473 | -0.00857 ± 0.0566 | 0.0124 ± 0.0577 |
origin | 0.335 ± 0.111 | -0.255 ± 0.122 | -0.0684 ± 0.149 | 0.0341 ± 0.161 |
leaf habit | 0.276 ± 0.0413 | -0.453 ± 0.0728 | -0.0103 ± 0.0505 | -0.0838 ± 0.0864 |
shoot growth type | 0.0685 ± 0.0569 | 0.162 ± 0.0931 | 0.0287 ± 0.0691 | -0.0895 ± 0.112 |
shade tolerance index | 0.133 ± 0.0469 | -0.0196 ± 0.0480 | -0.0133 ± 0.0565 | 0.0352 ± 0.0568 |
drought tolerance index | 0.130 ± 0.0468 | 0.0358 ± 0.0476 | -0.0126 ± 0.0564 | 0.0212 ± 0.0569 |
specific leaf area | 0.130 ± 0.0373 | 0.193 ± 0.0392 | -0.0165 ± 0.0449 | 0.0418 ± 0.0453 |
leaf C | 0.113 ± 0.0428 | -0.192 ± 0.0435 | -0.0366 ± 0.0524 | 0.0412 ± 0.0532 |
leaf N | 0.113 ± 0.0537 | 0.0786 ± 0.0546 | -0.0366 ± 0.0658 | -0.0133 ± 0.0668 |
leaf C/N | 0.113 ± 0.0519 | -0.109 ± 0.0527 | -0.0366 ± 0.0635 | 0.0239 ± 0.0645 |
net photosynthetic rate | 0.132 ± 0.0469 | -0.0160 ± 0.0479 | -0.0101 ± 0.0565 | -0.0367 ± 0.0567 |
stomatal conductance | 0.132 ± 0.0462 | 0.0653 ± 0.0467 | -0.0191 ± 0.0557 | -0.0158 ± 0.0564 |
Vcmax | 0.132 ± 0.0453 | -0.0766 ± 0.0462 | -0.00936 ± 0.0546 | -0.0543 ± 0.0549 |
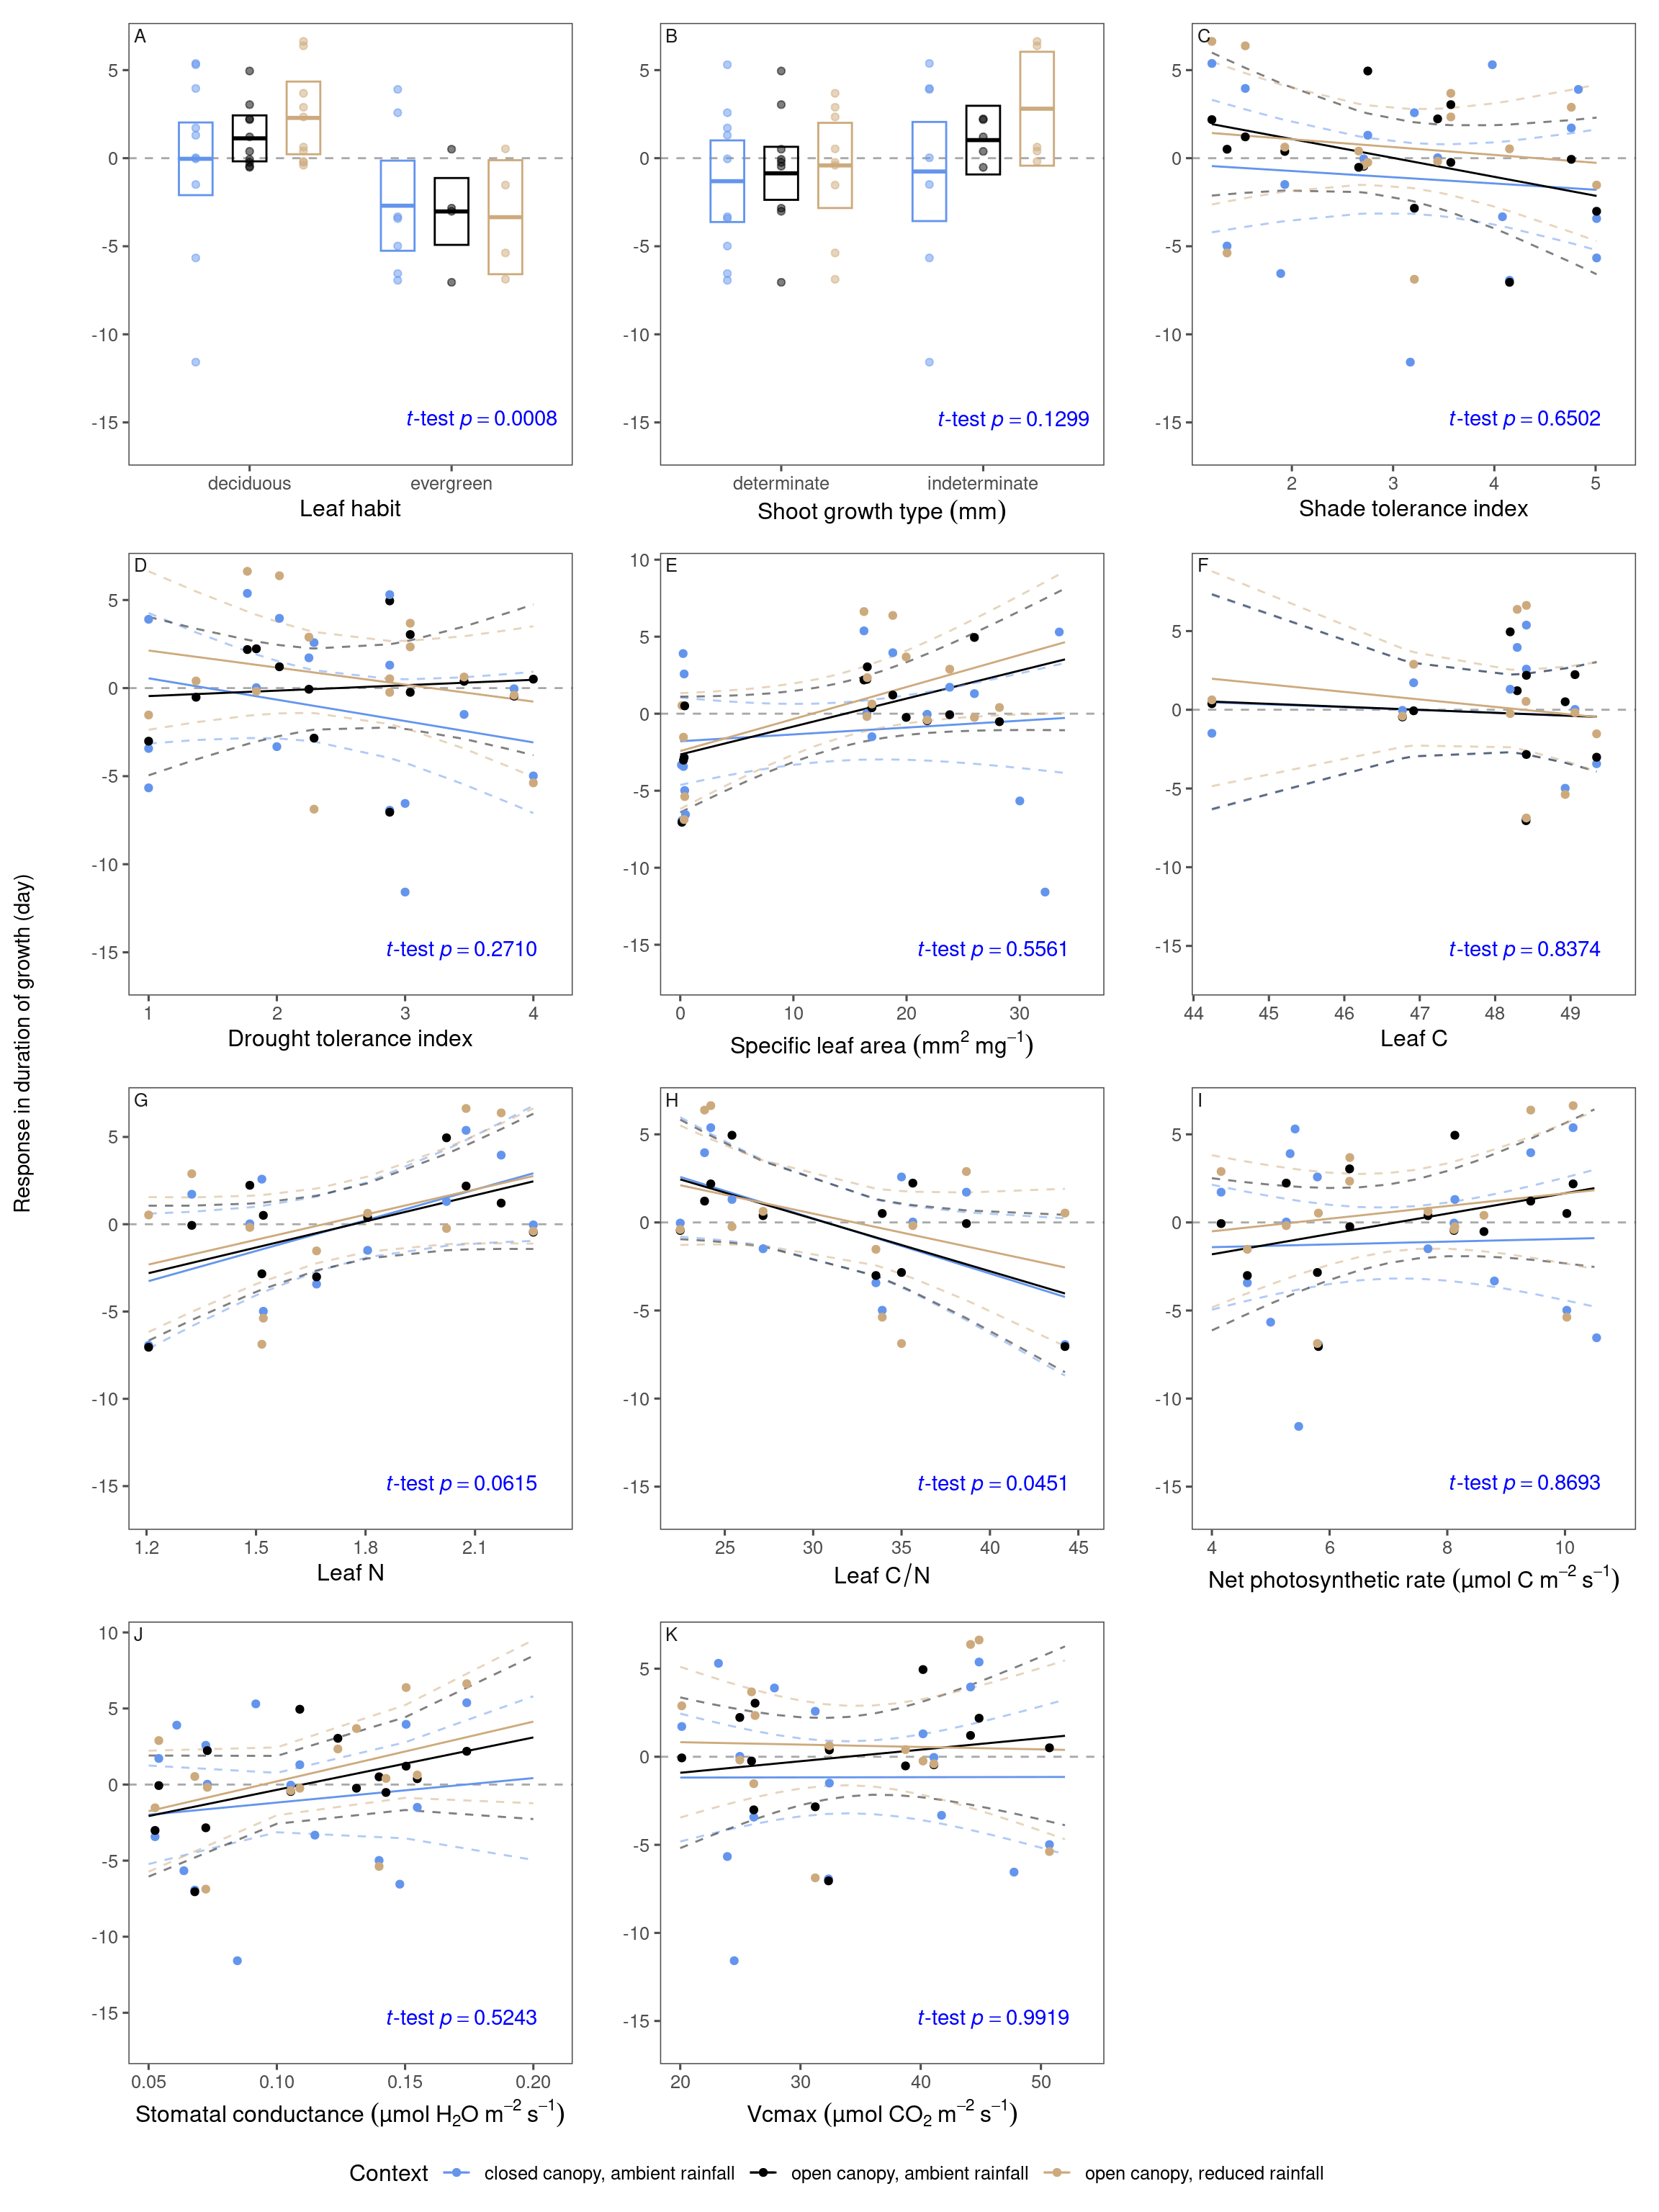
(C) duration of growth | ||||
|---|---|---|---|---|
lifestyle predictor | intercept | lifestyle effect | context effect | interaction |
biome | -0.466 ± 1.02 | 0.449 ± 1.27 | 1.41 ± 1.23 | -0.774 ± 1.53 |
northern range limit | -0.160 ± 0.595 | -0.698 ± 0.606 | 0.867 ± 0.717 | 0.537 ± 0.722 |
southern range limit | -0.107 ± 0.571 | -1.38 ± 0.577 | 0.611 ± 0.689 | 0.680 ± 0.699 |
range center | -0.117 ± 0.577 | -1.20 ± 0.582 | 0.714 ± 0.696 | 0.751 ± 0.708 |
temperature niche | -0.171 ± 0.574 | 1.04 ± 0.590 | 0.897 ± 0.691 | -0.779 ± 0.694 |
precipitation niche | -0.214 ± 0.601 | -0.0677 ± 0.606 | 0.920 ± 0.724 | -0.875 ± 0.738 |
origin | 0.430 ± 1.51 | -0.840 ± 1.66 | 1.45 ± 2.03 | -0.772 ± 2.18 |
leaf habit | 1.13 ± 0.646 | -4.15 ± 1.14 | 1.16 ± 0.791 | -1.49 ± 1.35 |
shoot growth type | -0.859 ± 0.745 | 1.89 ± 1.22 | 0.448 ± 0.905 | 1.33 ± 1.46 |
shade tolerance index | -0.187 ± 0.602 | -0.738 ± 0.616 | 0.835 ± 0.726 | -0.0969 ± 0.729 |
drought tolerance index | -0.180 ± 0.604 | -0.592 ± 0.613 | 0.956 ± 0.728 | 0.157 ± 0.733 |
specific leaf area | -0.200 ± 0.562 | 1.55 ± 0.591 | 0.865 ± 0.677 | 0.949 ± 0.683 |
leaf C | -0.0432 ± 0.656 | -0.396 ± 0.666 | 0.199 ± 0.803 | -0.212 ± 0.816 |
leaf N | -0.0432 ± 0.571 | 1.81 ± 0.580 | 0.199 ± 0.699 | -0.182 ± 0.710 |
leaf C/N | -0.0432 ± 0.561 | -1.89 ± 0.570 | 0.199 ± 0.687 | 0.338 ± 0.698 |
net photosynthetic rate | -0.184 ± 0.602 | 0.652 ± 0.615 | 0.889 ± 0.725 | 0.319 ± 0.728 |
stomatal conductance | -0.224 ± 0.584 | 1.19 ± 0.590 | 0.774 ± 0.704 | 0.458 ± 0.712 |
Vcmax | -0.175 ± 0.610 | 0.141 ± 0.621 | 0.907 ± 0.735 | -0.0348 ± 0.739 |
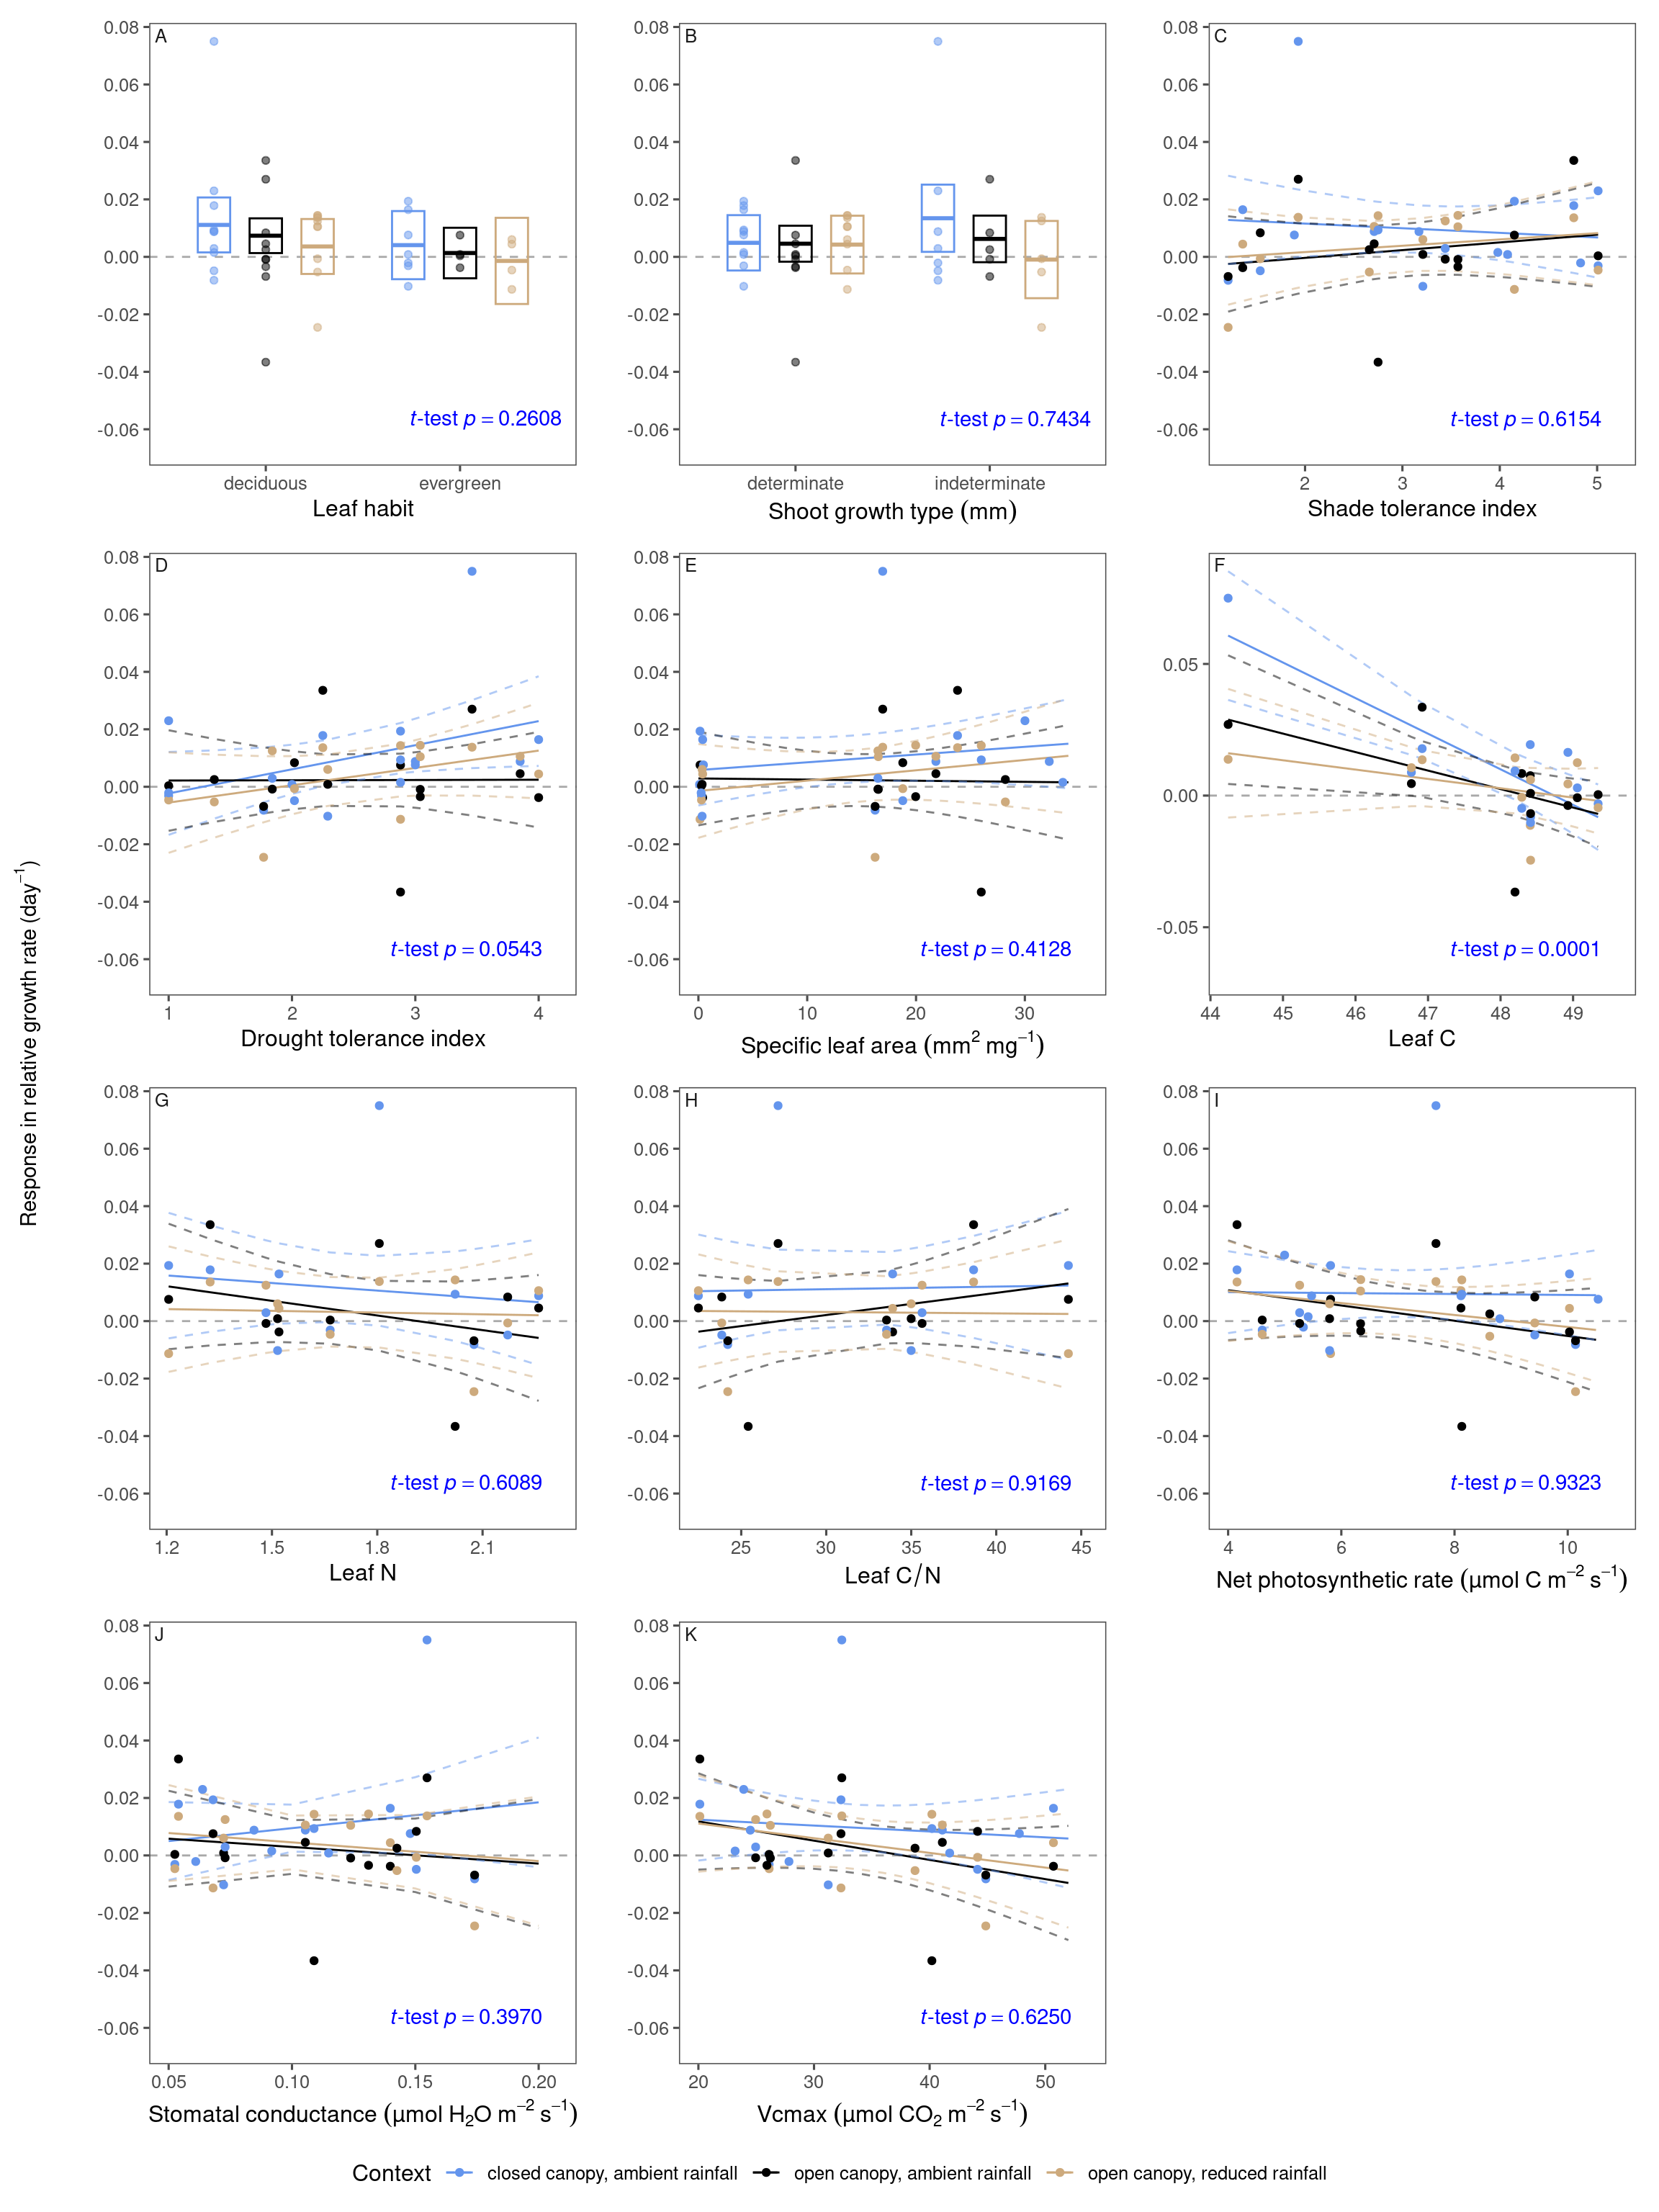
(D) relative growth rate | ||||
|---|---|---|---|---|
lifestyle predictor | intercept | lifestyle effect | context effect | interaction |
biome | -0.000985 ± 0.00399 | 0.00982 ± 0.00497 | -0.00529 ± 0.00481 | 0.00357 ± 0.00599 |
northern range limit | 0.00522 ± 0.00242 | -0.00304 ± 0.00247 | -0.00312 ± 0.00292 | -0.00331 ± 0.00294 |
southern range limit | 0.00497 ± 0.00248 | -0.00227 ± 0.00251 | -0.00331 ± 0.00299 | -0.00263 ± 0.00303 |
range center | 0.00503 ± 0.00245 | -0.00268 ± 0.00247 | -0.00327 ± 0.00295 | -0.00305 ± 0.00300 |
temperature niche | 0.00532 ± 0.00244 | 0.00303 ± 0.00251 | -0.00303 ± 0.00294 | 0.00269 ± 0.00295 |
precipitation niche | 0.00551 ± 0.00244 | 0.000913 ± 0.00246 | -0.00302 ± 0.00295 | 0.00392 ± 0.00300 |
origin | 0.0220 ± 0.00545 | -0.0191 ± 0.00599 | -0.0215 ± 0.00731 | 0.0196 ± 0.00787 |
leaf habit | 0.00736 ± 0.00299 | -0.00603 ± 0.00528 | -0.00375 ± 0.00367 | 0.00101 ± 0.00627 |
shoot growth type | 0.00458 ± 0.00310 | 0.00167 ± 0.00507 | -0.000307 ± 0.00376 | -0.00688 ± 0.00608 |
shade tolerance index | 0.00551 ± 0.00248 | 0.00131 ± 0.00254 | -0.00294 ± 0.00299 | 0.00237 ± 0.00300 |
drought tolerance index | 0.00538 ± 0.00239 | 0.00447 ± 0.00243 | -0.00336 ± 0.00288 | -0.00123 ± 0.00290 |
specific leaf area | 0.00533 ± 0.00247 | 0.00236 ± 0.00260 | -0.00308 ± 0.00298 | 0.000181 ± 0.00300 |
leaf C | 0.00581 ± 0.00238 | -0.0113 ± 0.00242 | -0.00405 ± 0.00291 | 0.00702 ± 0.00296 |
leaf N | 0.00581 ± 0.00326 | -0.00321 ± 0.00331 | -0.00405 ± 0.00400 | 0.00117 ± 0.00406 |
leaf C/N | 0.00581 ± 0.00330 | 0.00186 ± 0.00335 | -0.00405 ± 0.00404 | -0.000476 ± 0.00411 |
net photosynthetic rate | 0.00539 ± 0.00244 | -0.00318 ± 0.00249 | -0.00292 ± 0.00294 | -0.00206 ± 0.00295 |
stomatal conductance | 0.00559 ± 0.00248 | -0.000504 ± 0.00251 | -0.00304 ± 0.00299 | -0.00297 ± 0.00302 |
Vcmax | 0.00536 ± 0.00241 | -0.00415 ± 0.00245 | -0.00295 ± 0.00290 | -0.00153 ± 0.00292 |
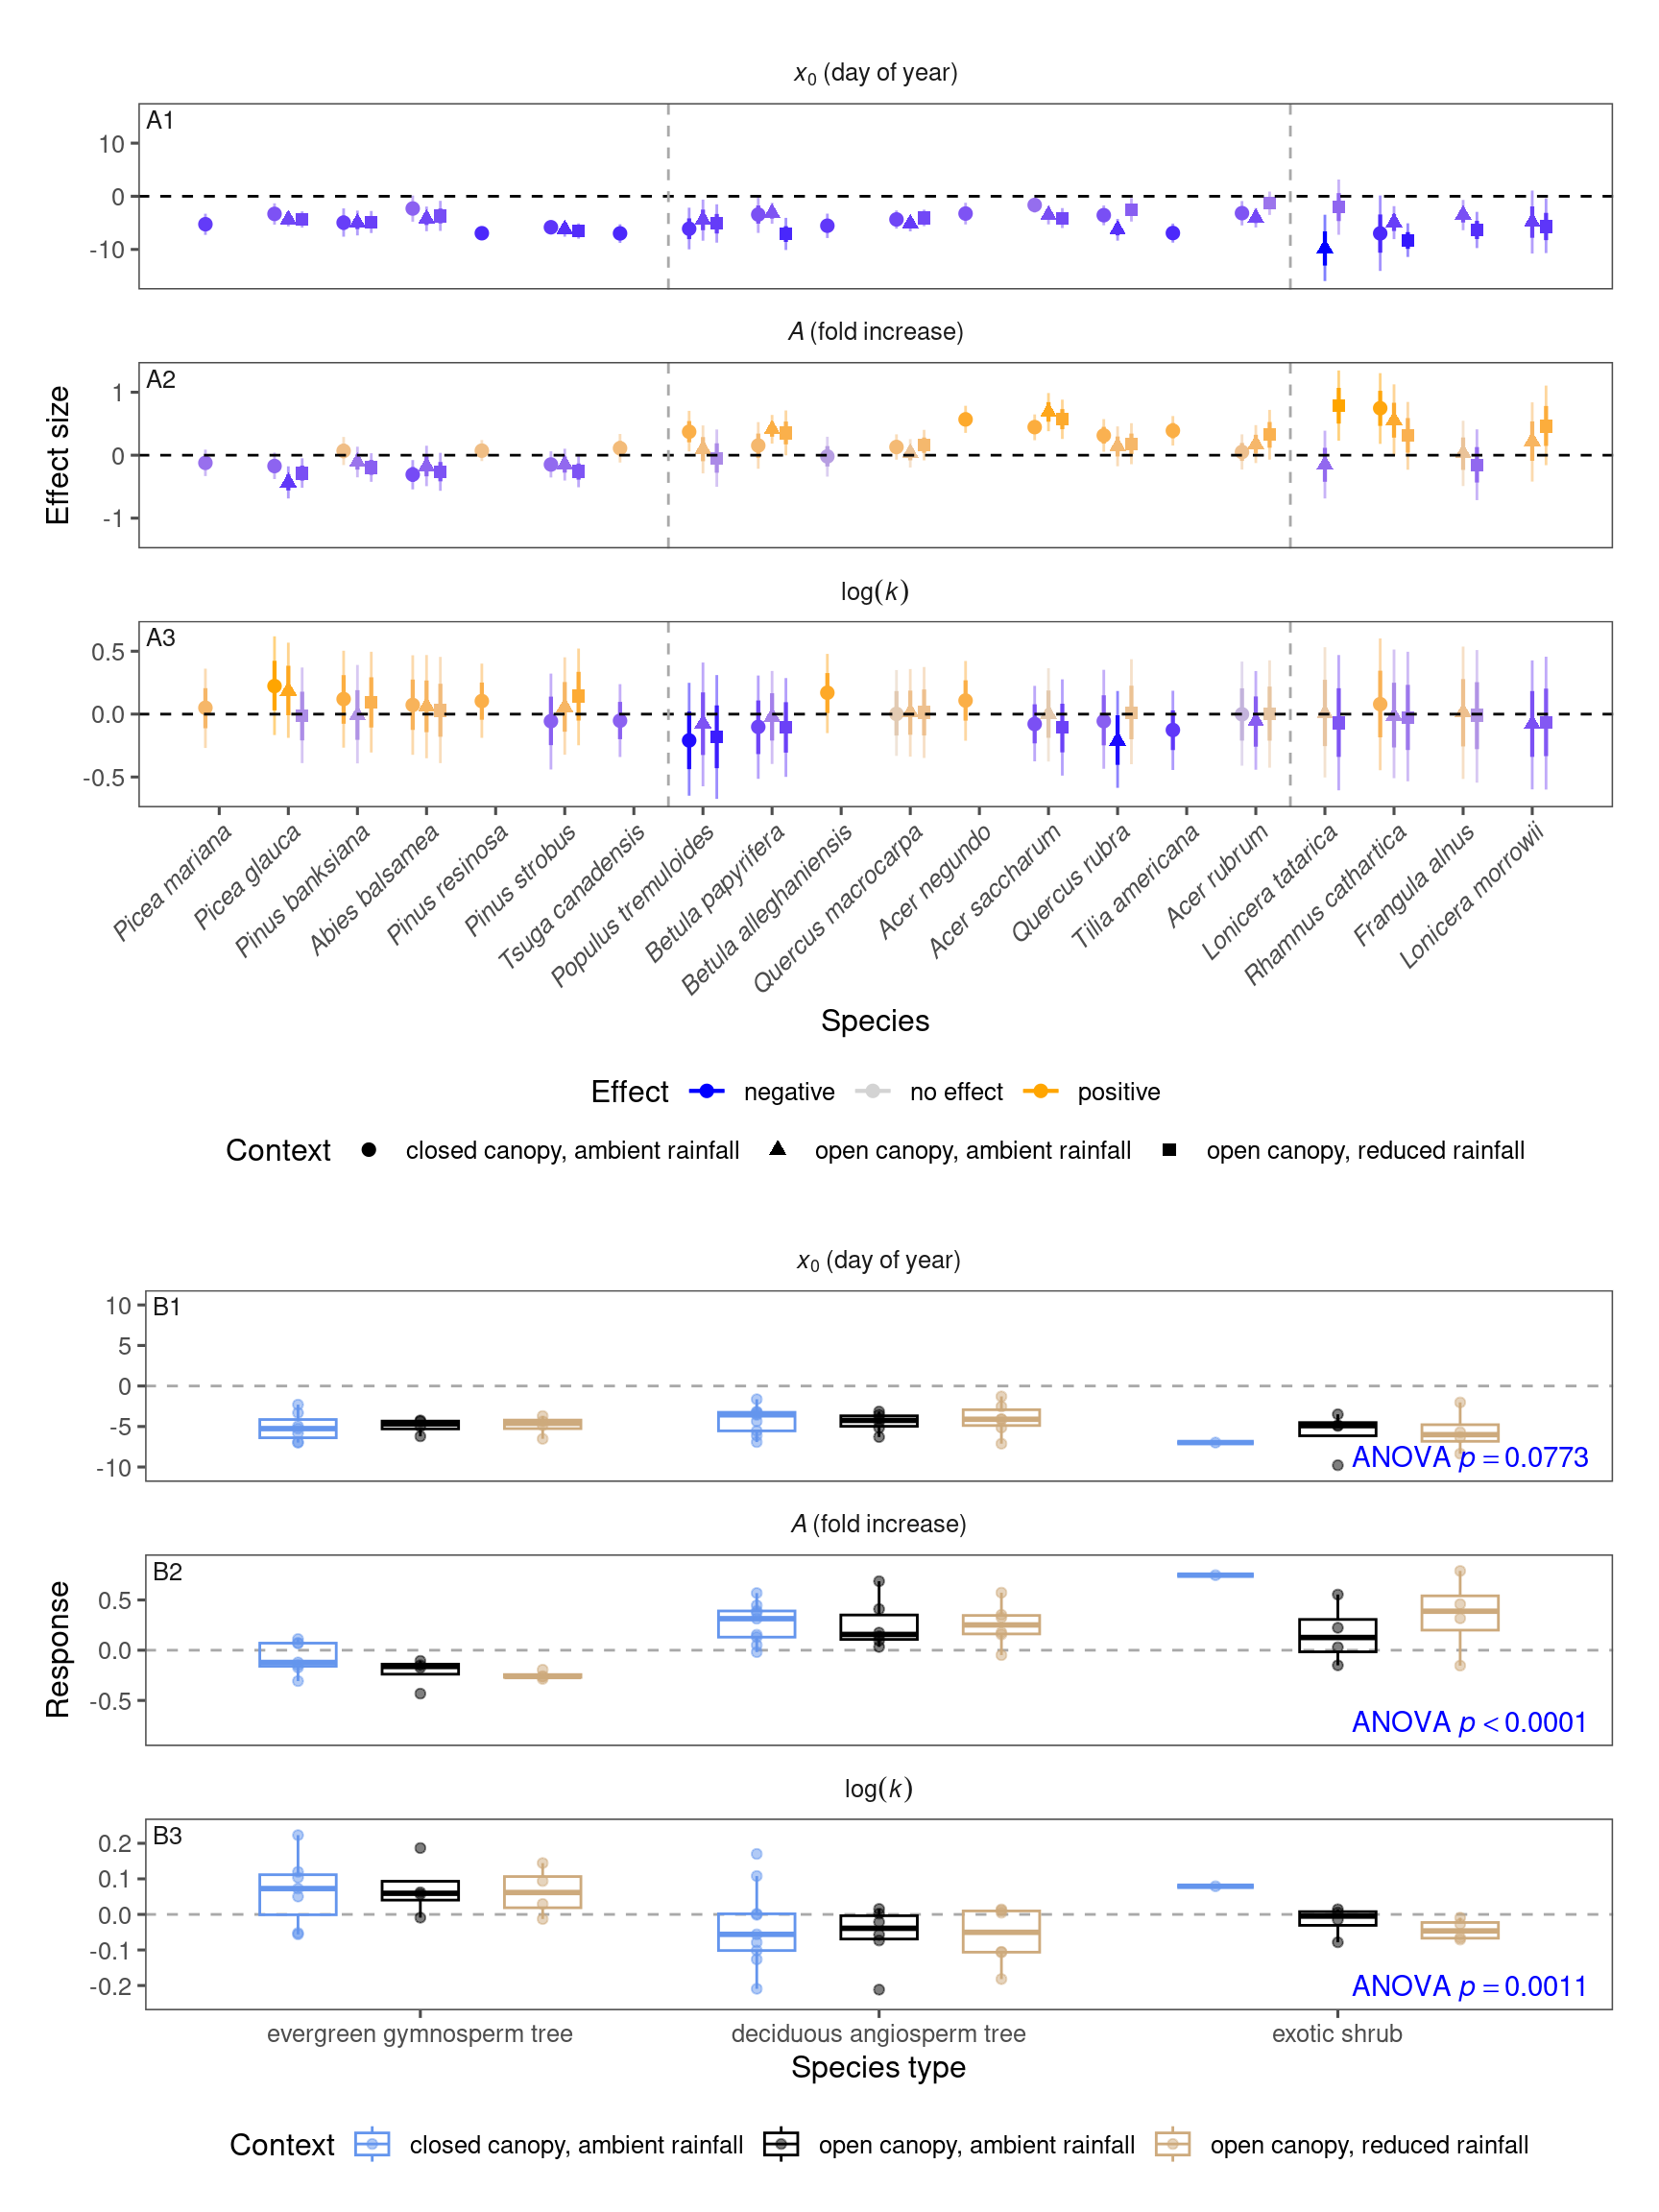
NLS
## [1] "Number of outliers removed for start: 9"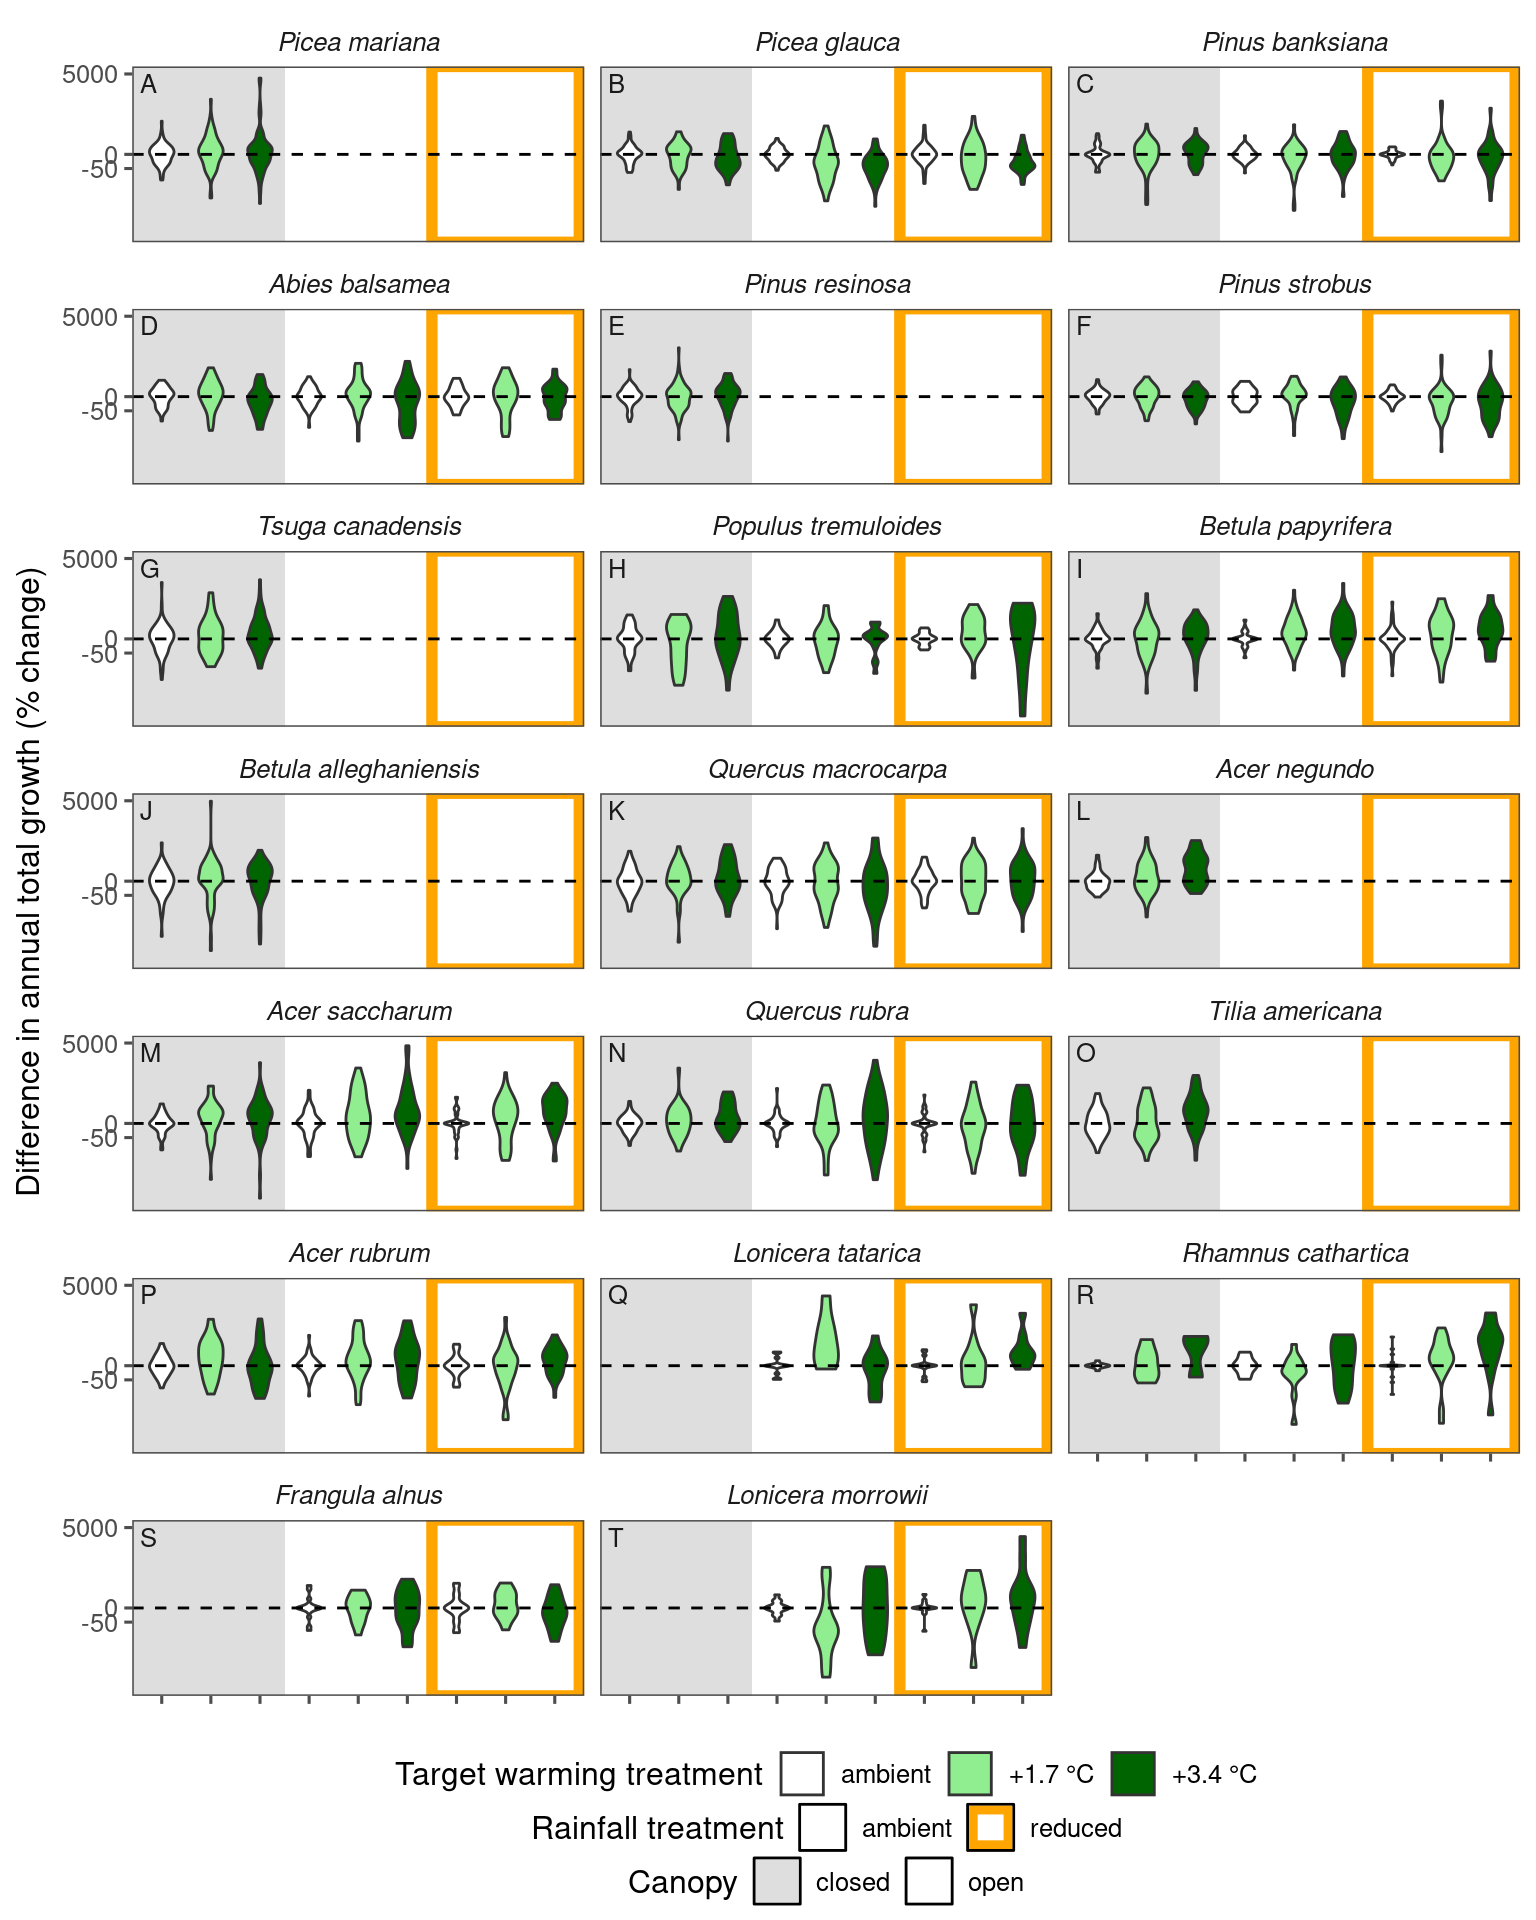
## [1] "Number of outliers removed for total growth: 4"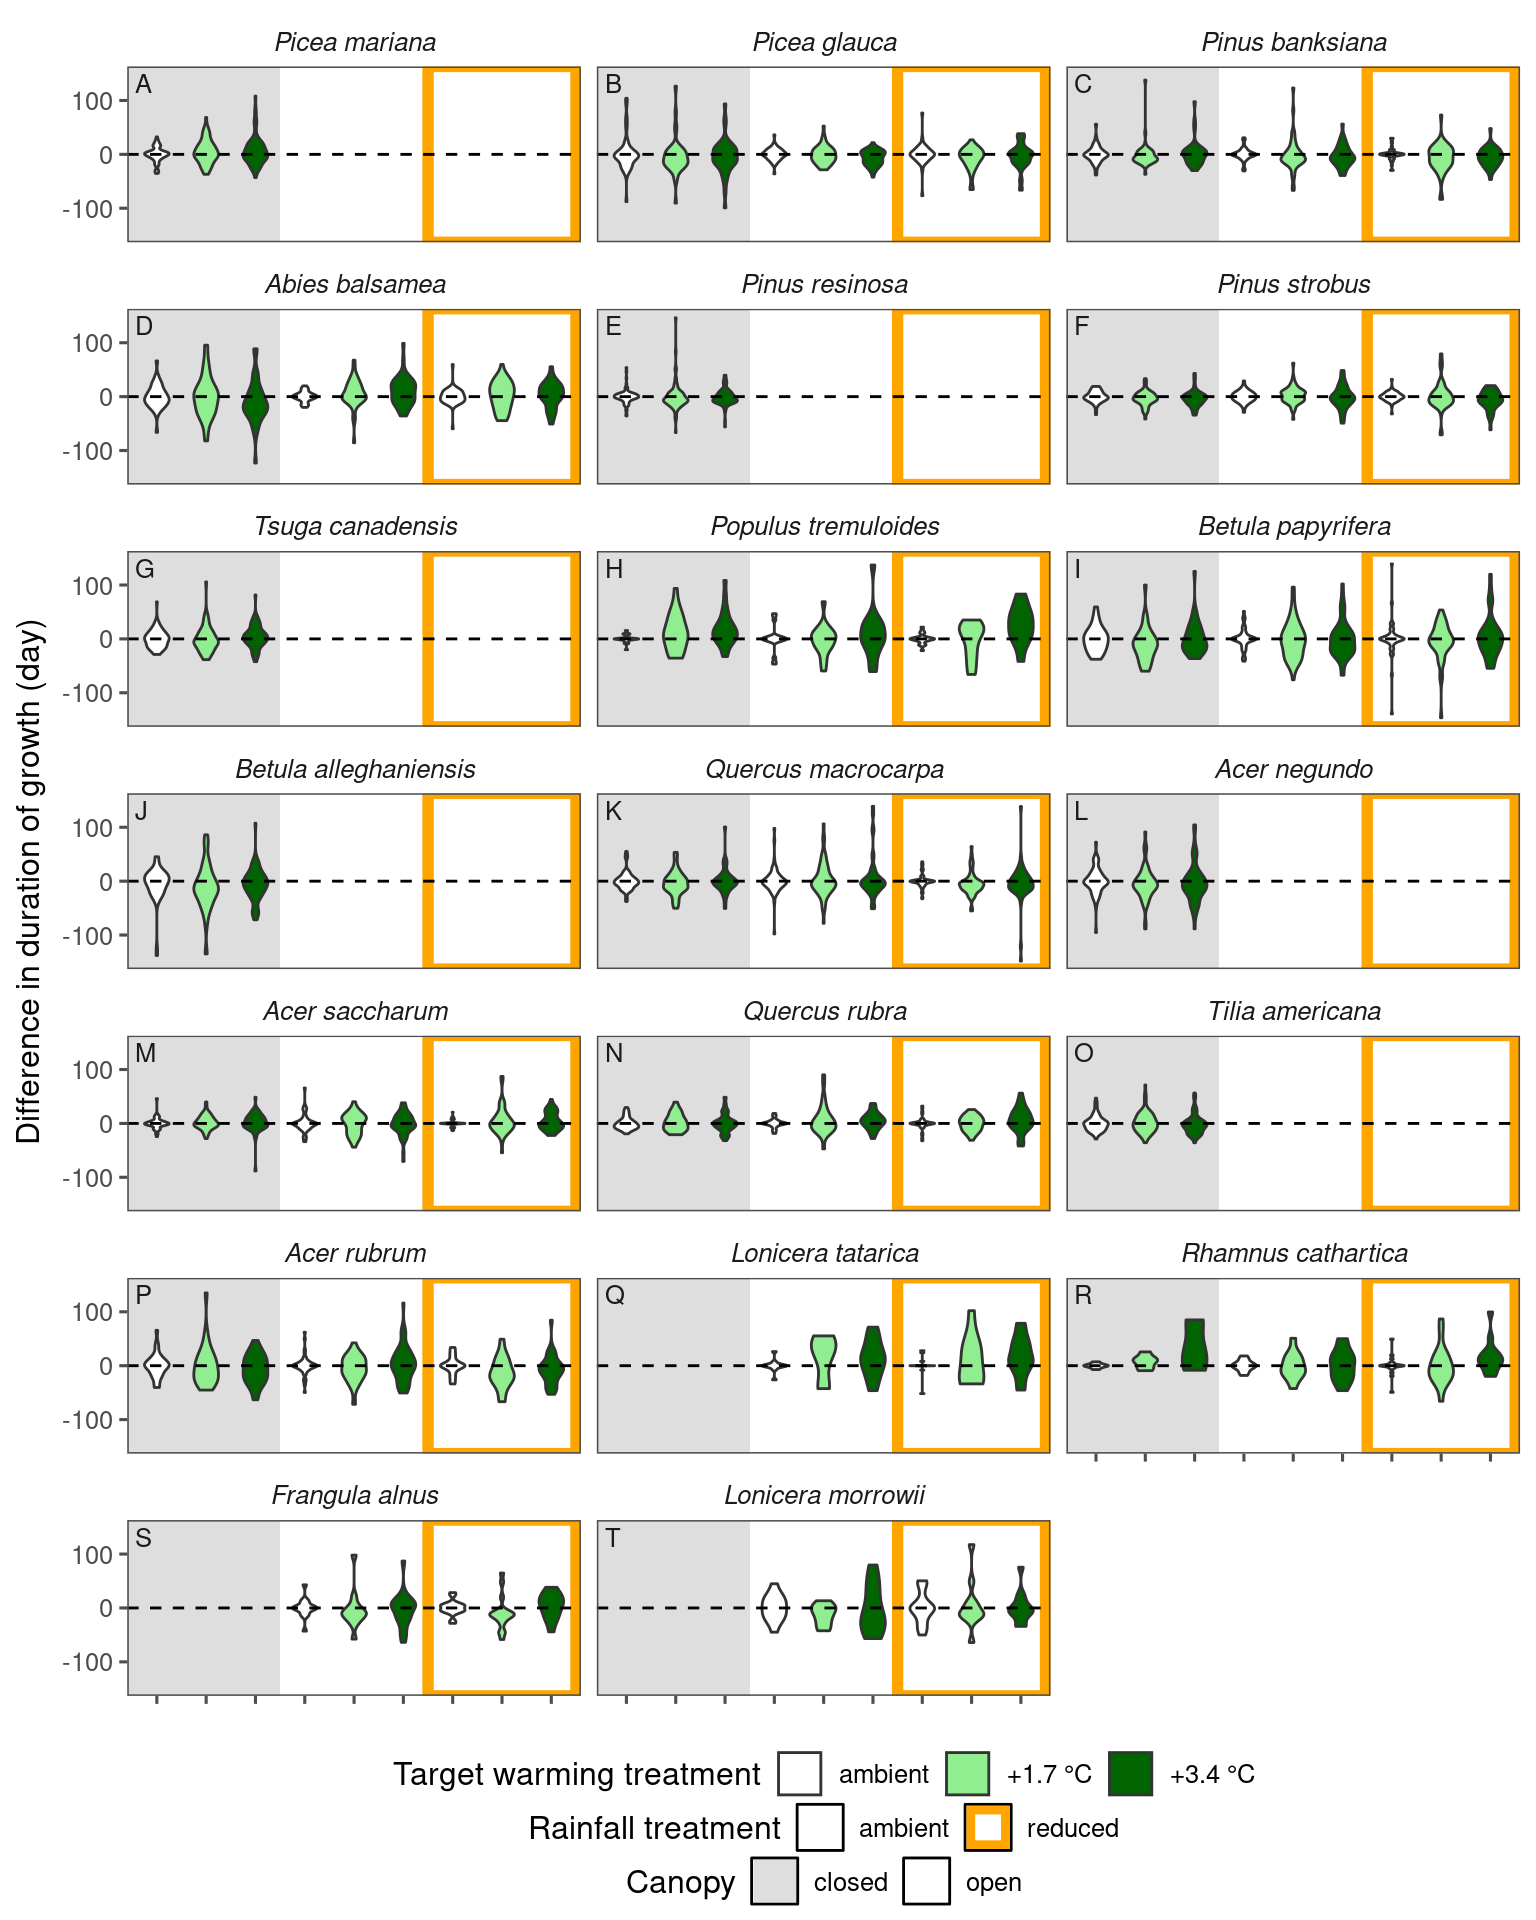
## [1] "Number of outliers removed for duration: 14"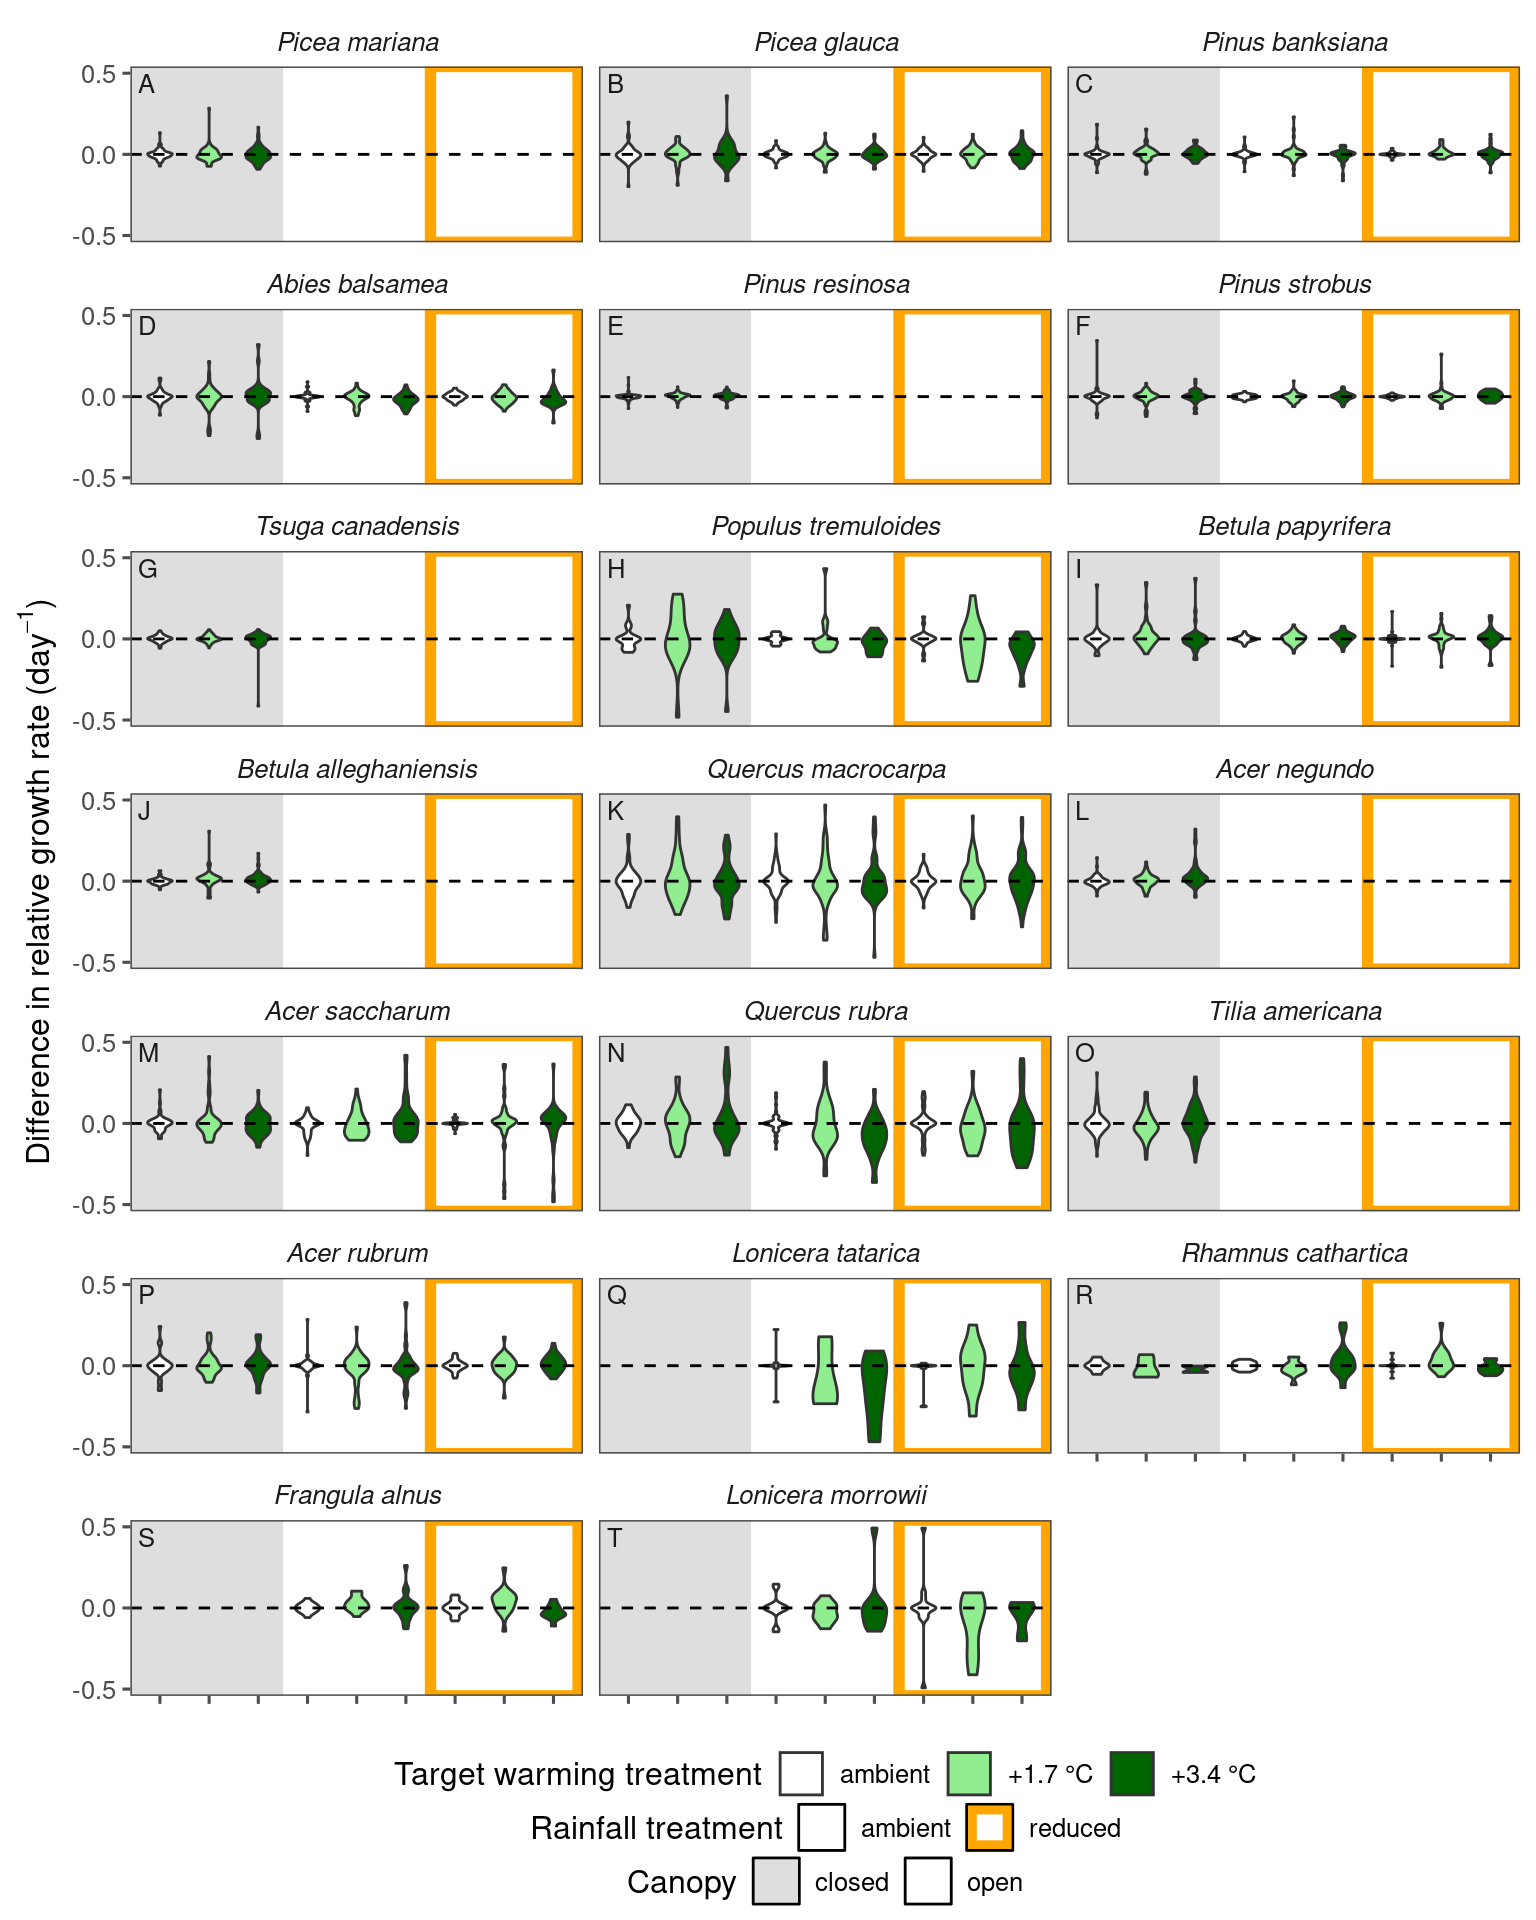
## [1] "Number of outliers removed for speed: 39"Coefficients
1.7 °C vs. 3.4 °C
## Linear mixed model fit by REML. t-tests use Satterthwaite's method [
## lmerModLmerTest]
## Formula: diff ~ heat + model + (1 | species)
##    Data: df_2trt
##
## REML criterion at convergence: 7774.8
##
## Scaled residuals:
##     Min      1Q  Median      3Q     Max
## -4.8707 -0.5137  0.0334  0.5389  6.9770
##
## Random effects:
##  Groups   Name        Variance Std.Dev.
##  species  (Intercept) 0.01437  0.1199
##  Residual             0.49955  0.7068
## Number of obs: 3604, groups:  species, 20
##
## Fixed effects:
##               Estimate Std. Error         df t value Pr(>|t|)
## (Intercept)  6.168e-02  3.241e-02  2.556e+01   1.903   0.0683 .
## heat++      -8.189e-04  2.358e-02  3.584e+03  -0.035   0.9723
## model       -1.669e-02  1.653e-02  1.747e+03  -1.010   0.3127
## ---
## Signif. codes:  0 '***' 0.001 '**' 0.01 '*' 0.05 '.' 0.1 ' ' 1
##
## Correlation of Fixed Effects:
##        (Intr) heat++
## heat++ -0.354
## model   0.115  0.015
Year-by-year effects
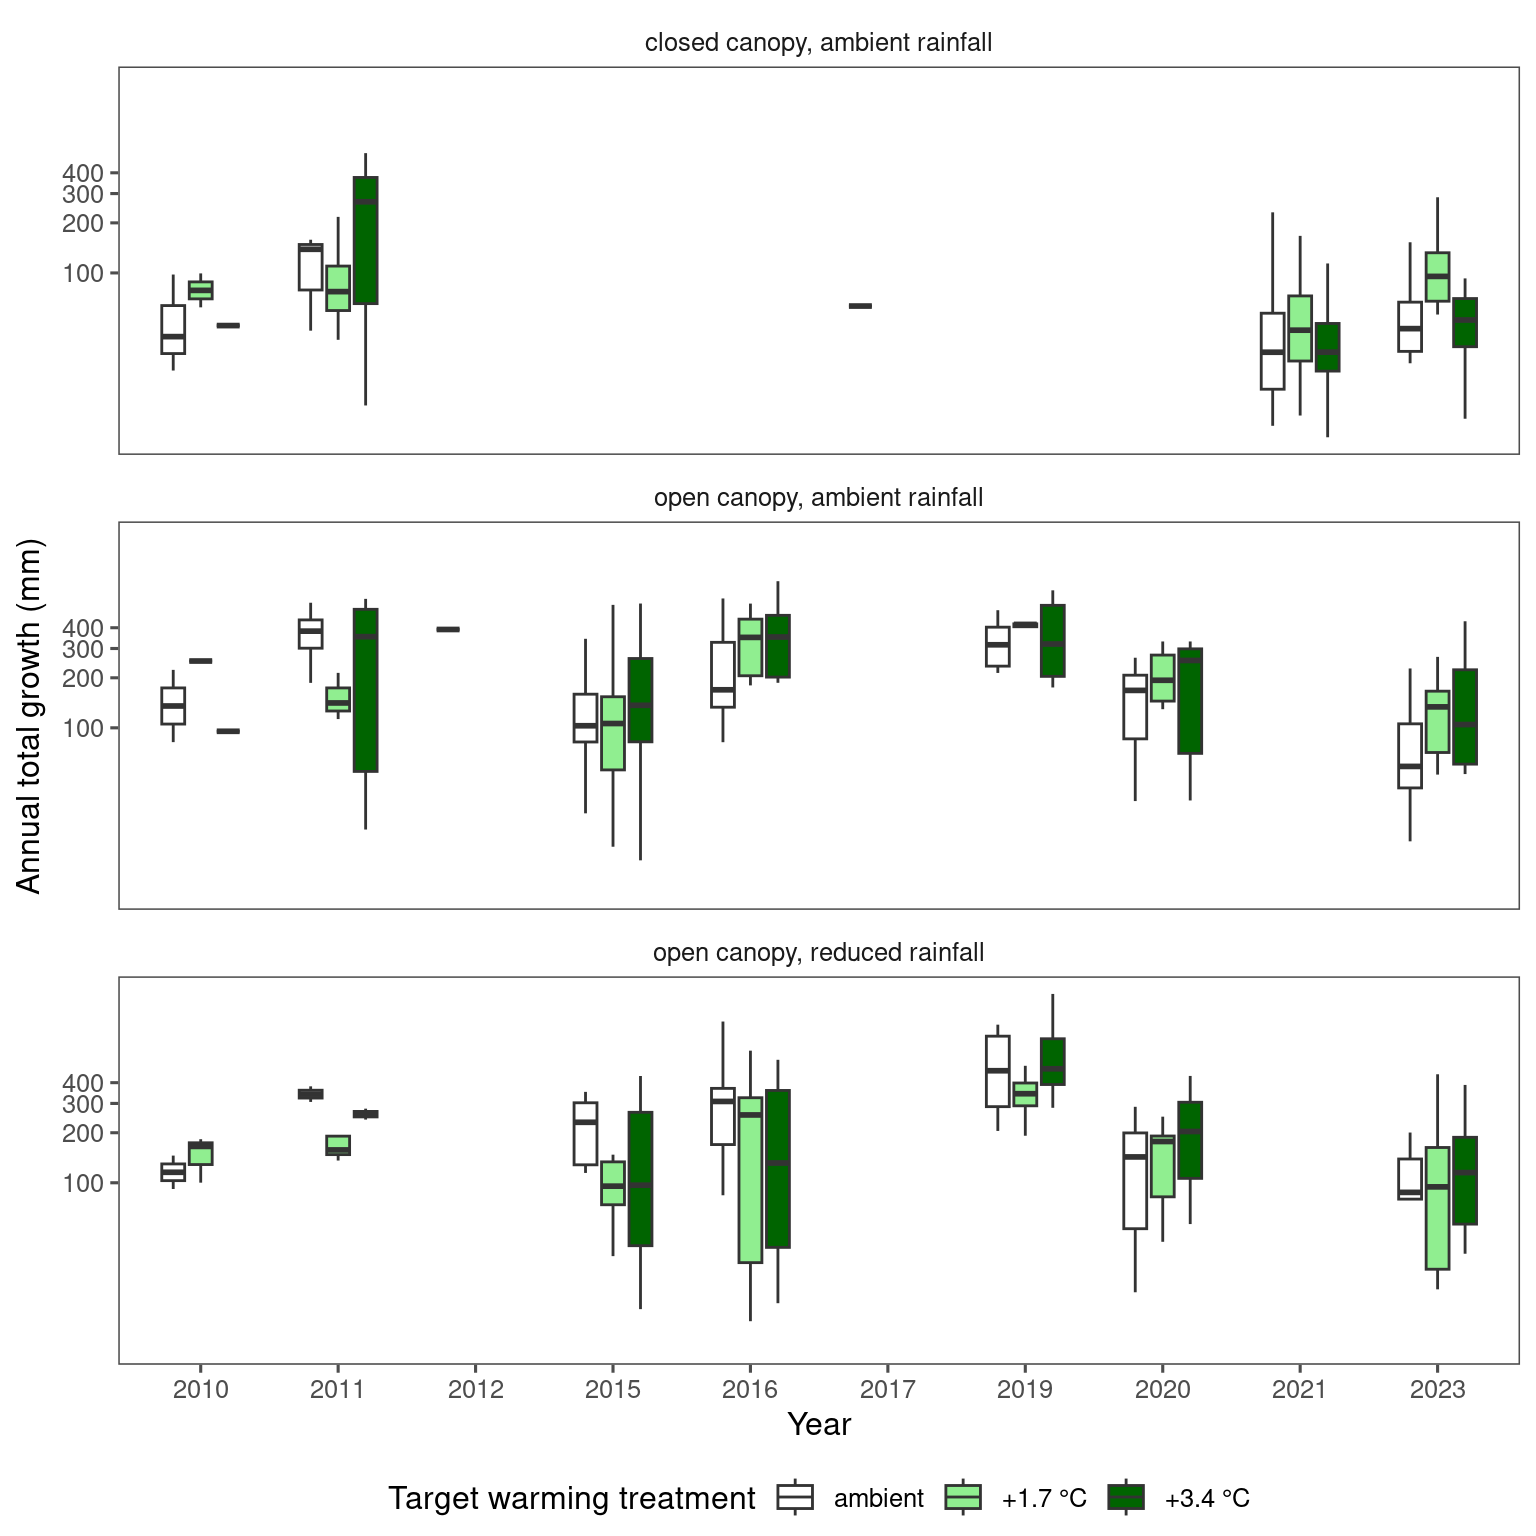
## Linear mixed model fit by REML. t-tests use Satterthwaite's method [
## lmerModLmerTest]
## Formula: diff ~ year + model + (1 | species)
##    Data: df_yrs
##
## REML criterion at convergence: 7778
##
## Scaled residuals:
##     Min      1Q  Median      3Q     Max
## -4.8739 -0.5111  0.0306  0.5375  6.9780
##
## Random effects:
##  Groups   Name        Variance Std.Dev.
##  species  (Intercept) 0.0147   0.1212
##  Residual             0.4994   0.7067
## Number of obs: 3604, groups:  species, 20
##
## Fixed effects:
##               Estimate Std. Error         df t value Pr(>|t|)
## (Intercept) -4.945e+00  8.137e+00  2.345e+03  -0.608    0.543
## year         2.481e-03  4.032e-03  2.344e+03   0.615    0.538
## model       -1.439e-02  1.693e-02  1.261e+03  -0.850    0.395
##
## Correlation of Fixed Effects:
##       (Intr) year
## year  -1.000
## model -0.213  0.214