These figures illustrate the maximum number of individual plants sampled within a species, site, year, treatment, block, and plot. The purpose are to 1) visualize study design, 2) clarify sample size, and 3) spot potentially problematic data.
v_species <- dat_shoot %>%
  pull(species) %>%
  unique()

lapply(v_species, function(sp) {
  (plot_study_design(dat_shoot, sp))
})
## [[1]]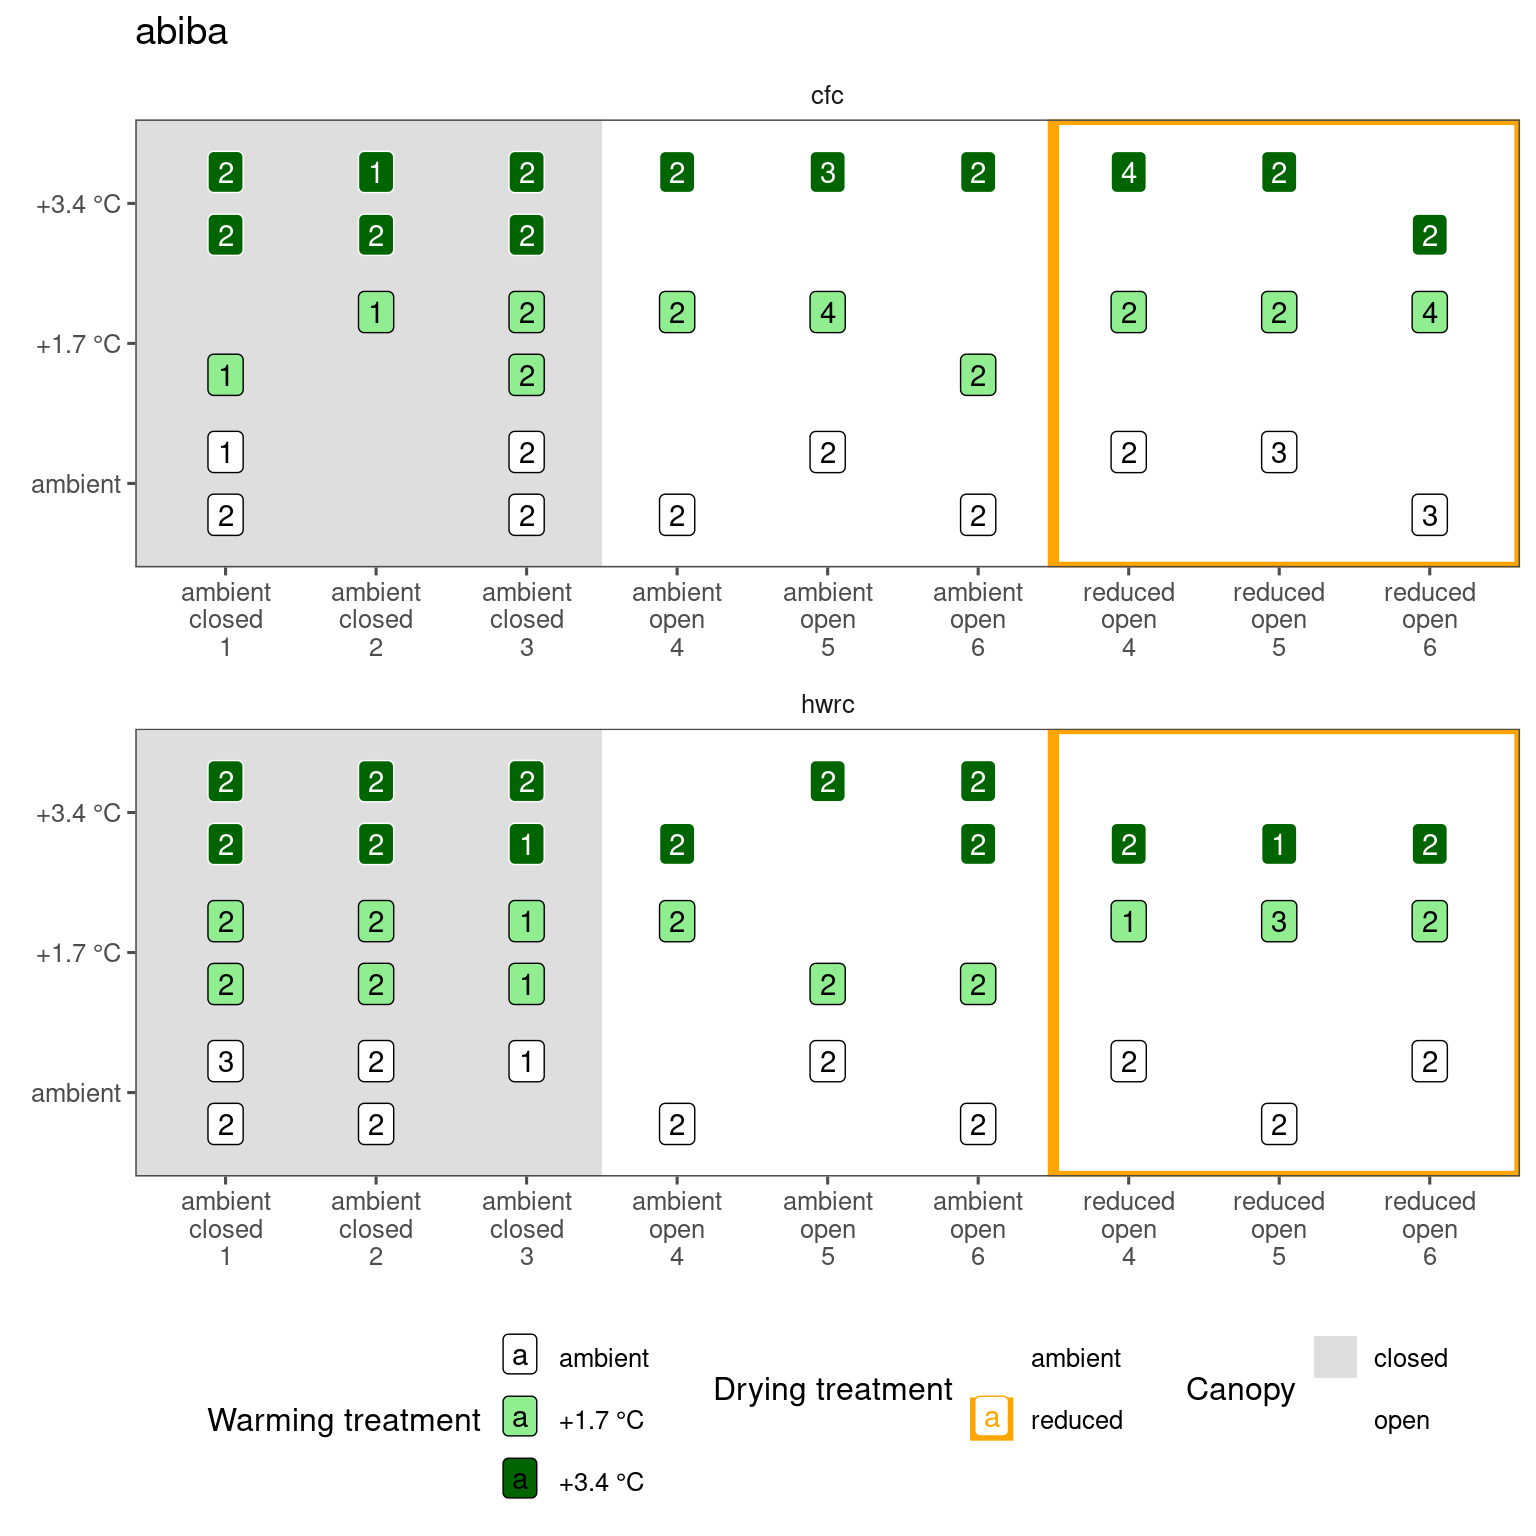
##
## [[2]]
##
## [[3]]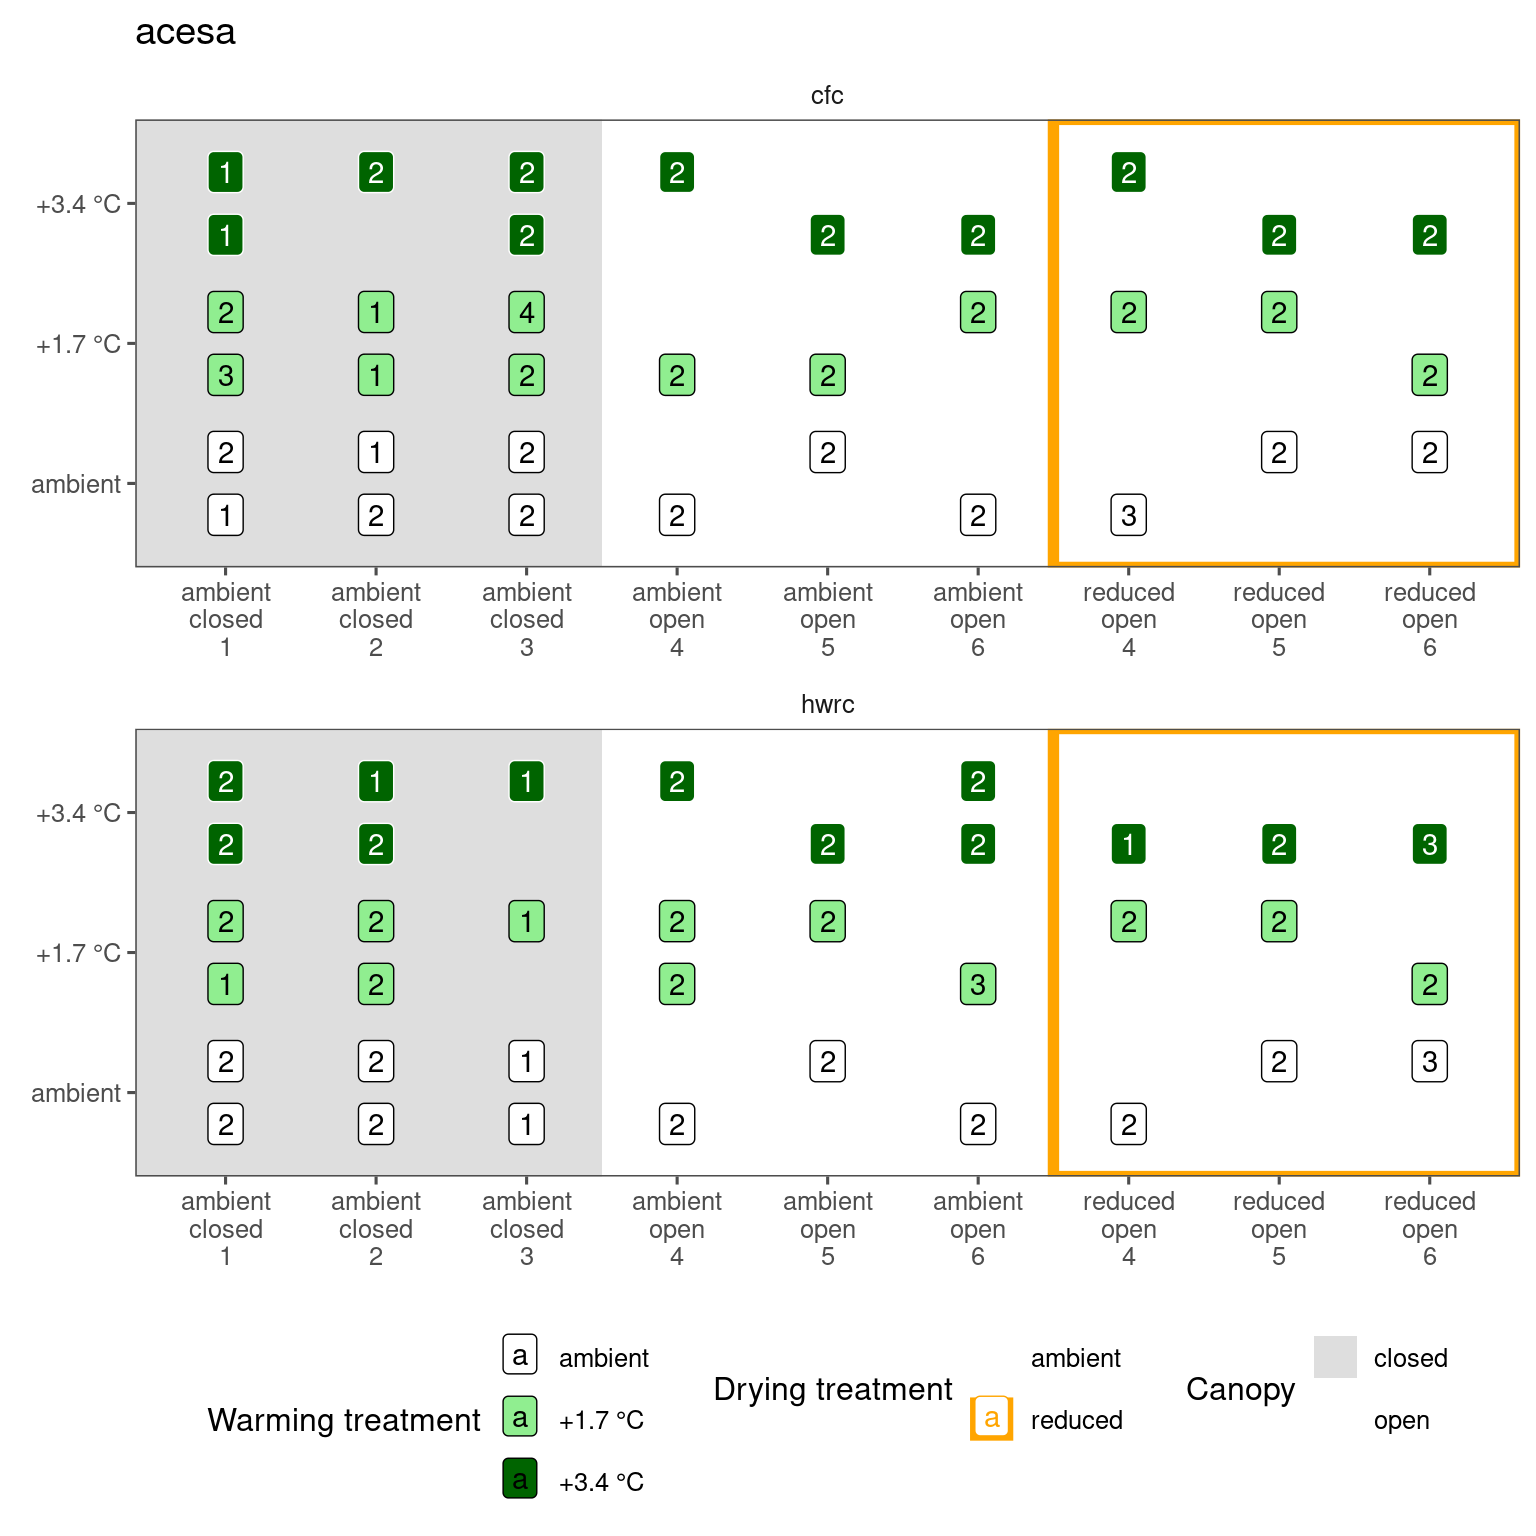
##
## [[4]]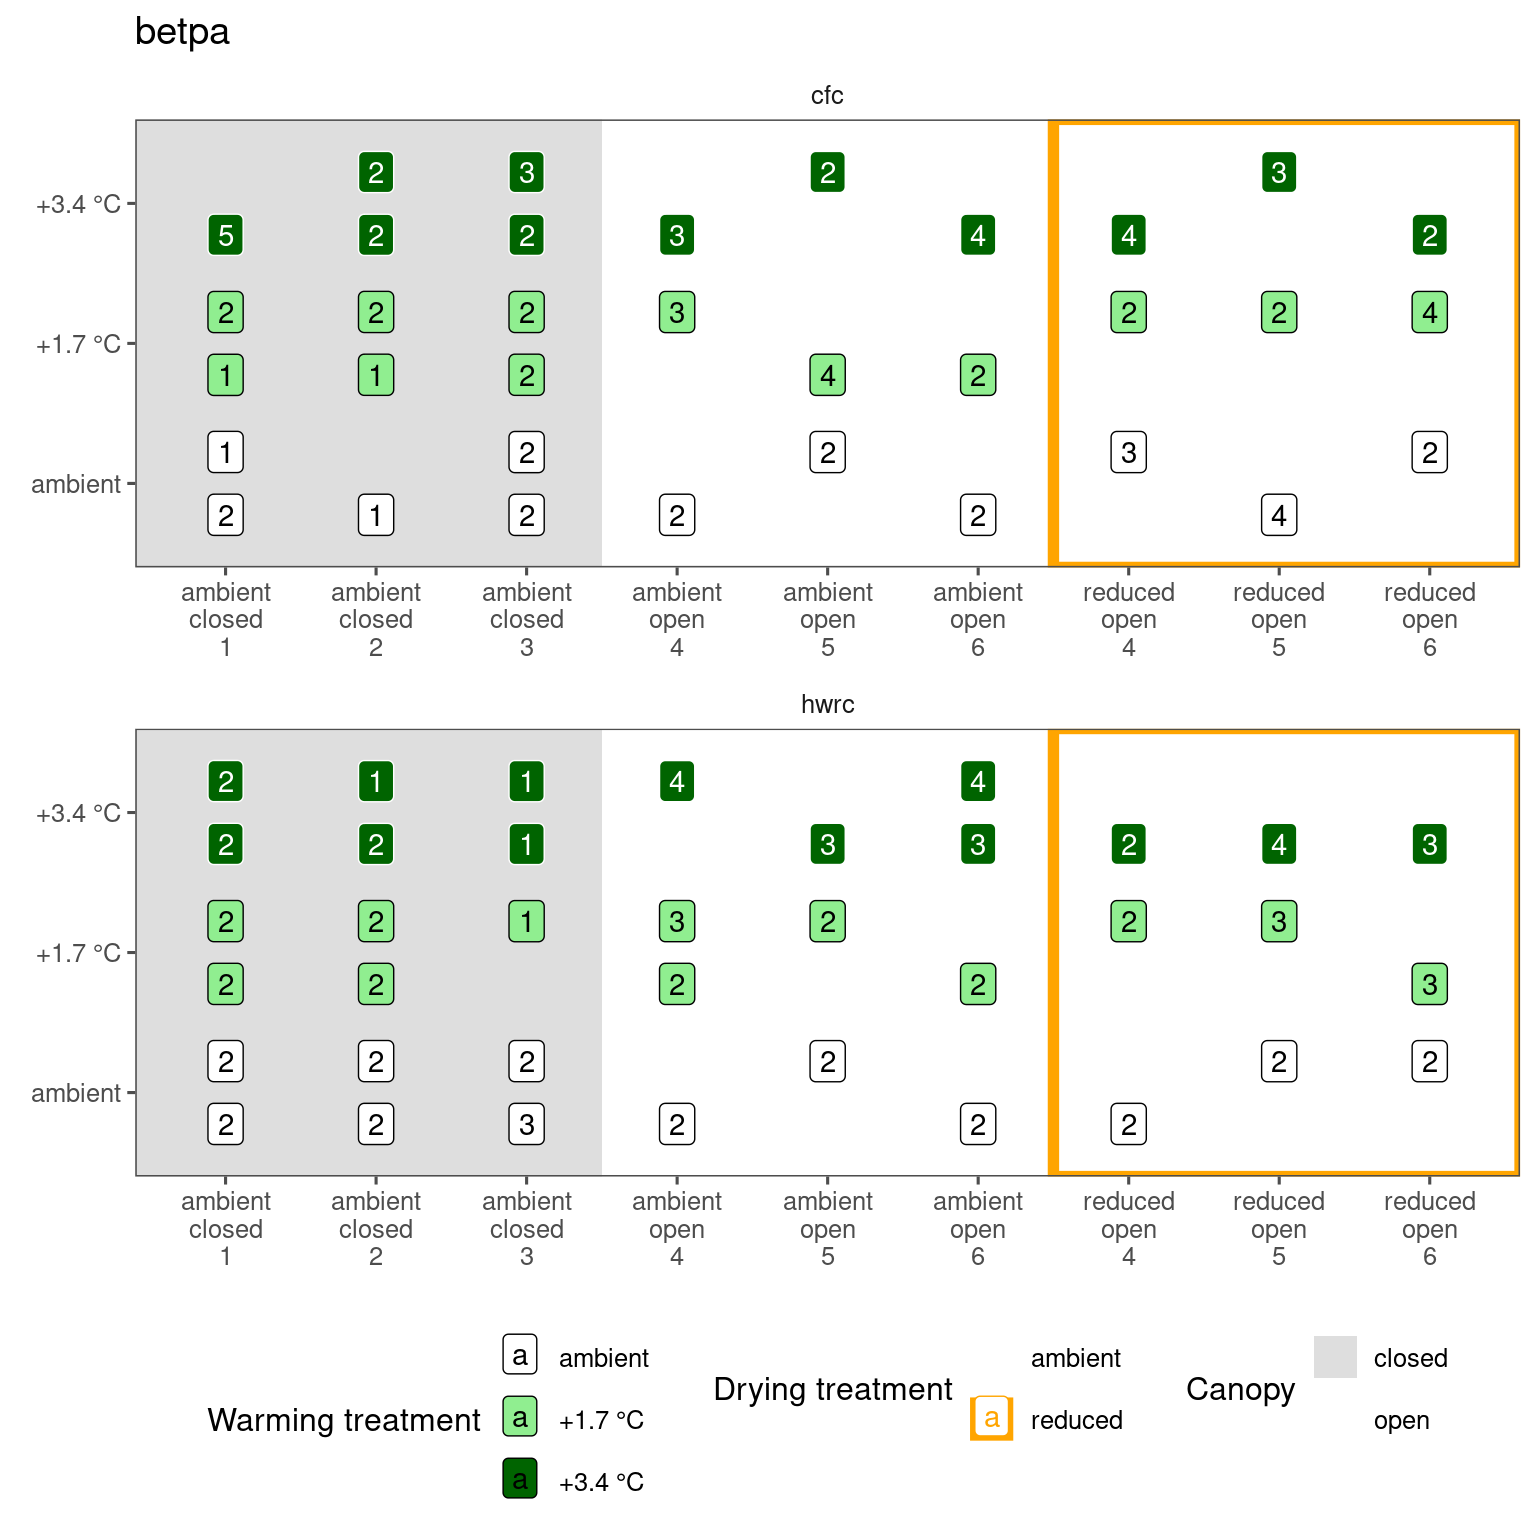
##
## [[5]]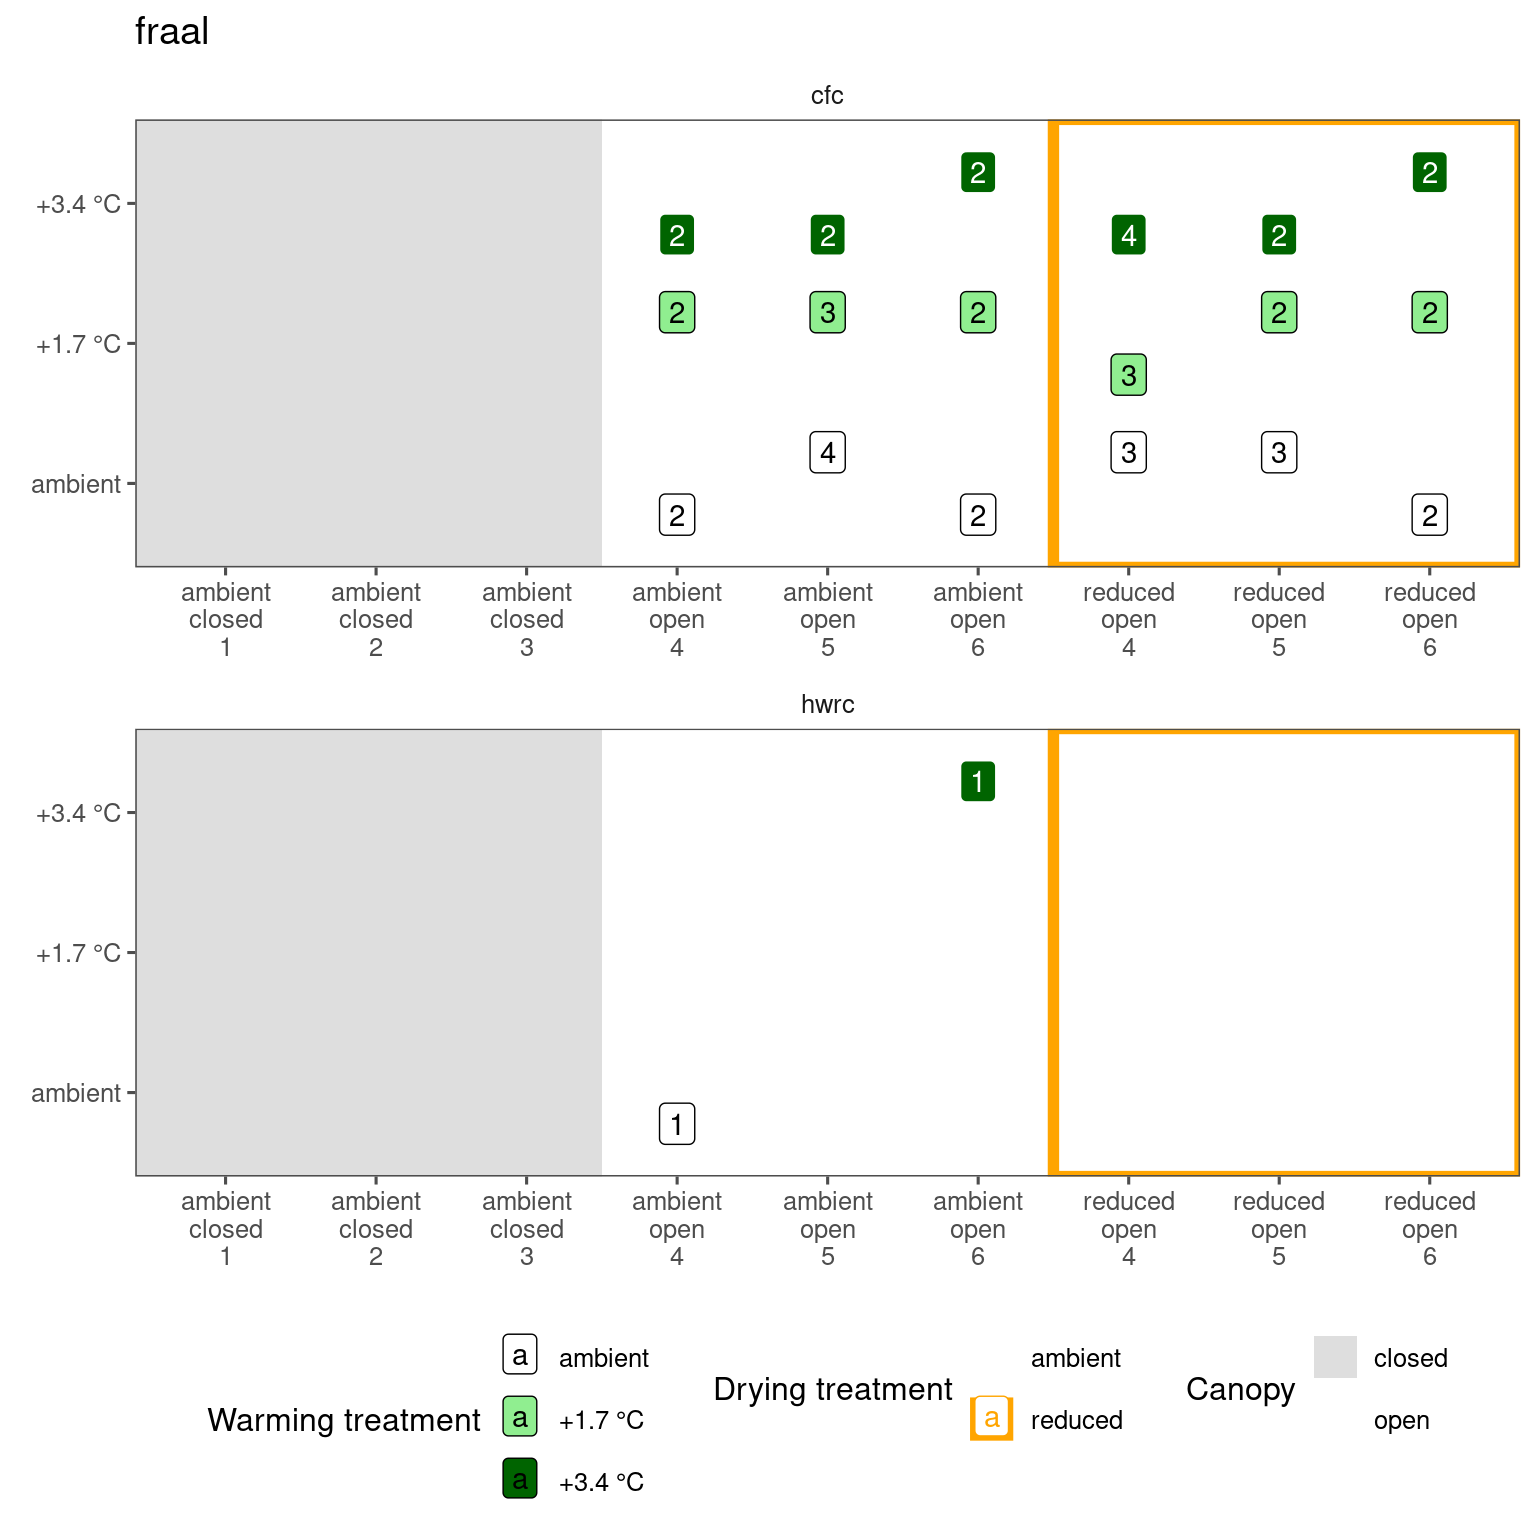
##
## [[6]]
##
## [[7]]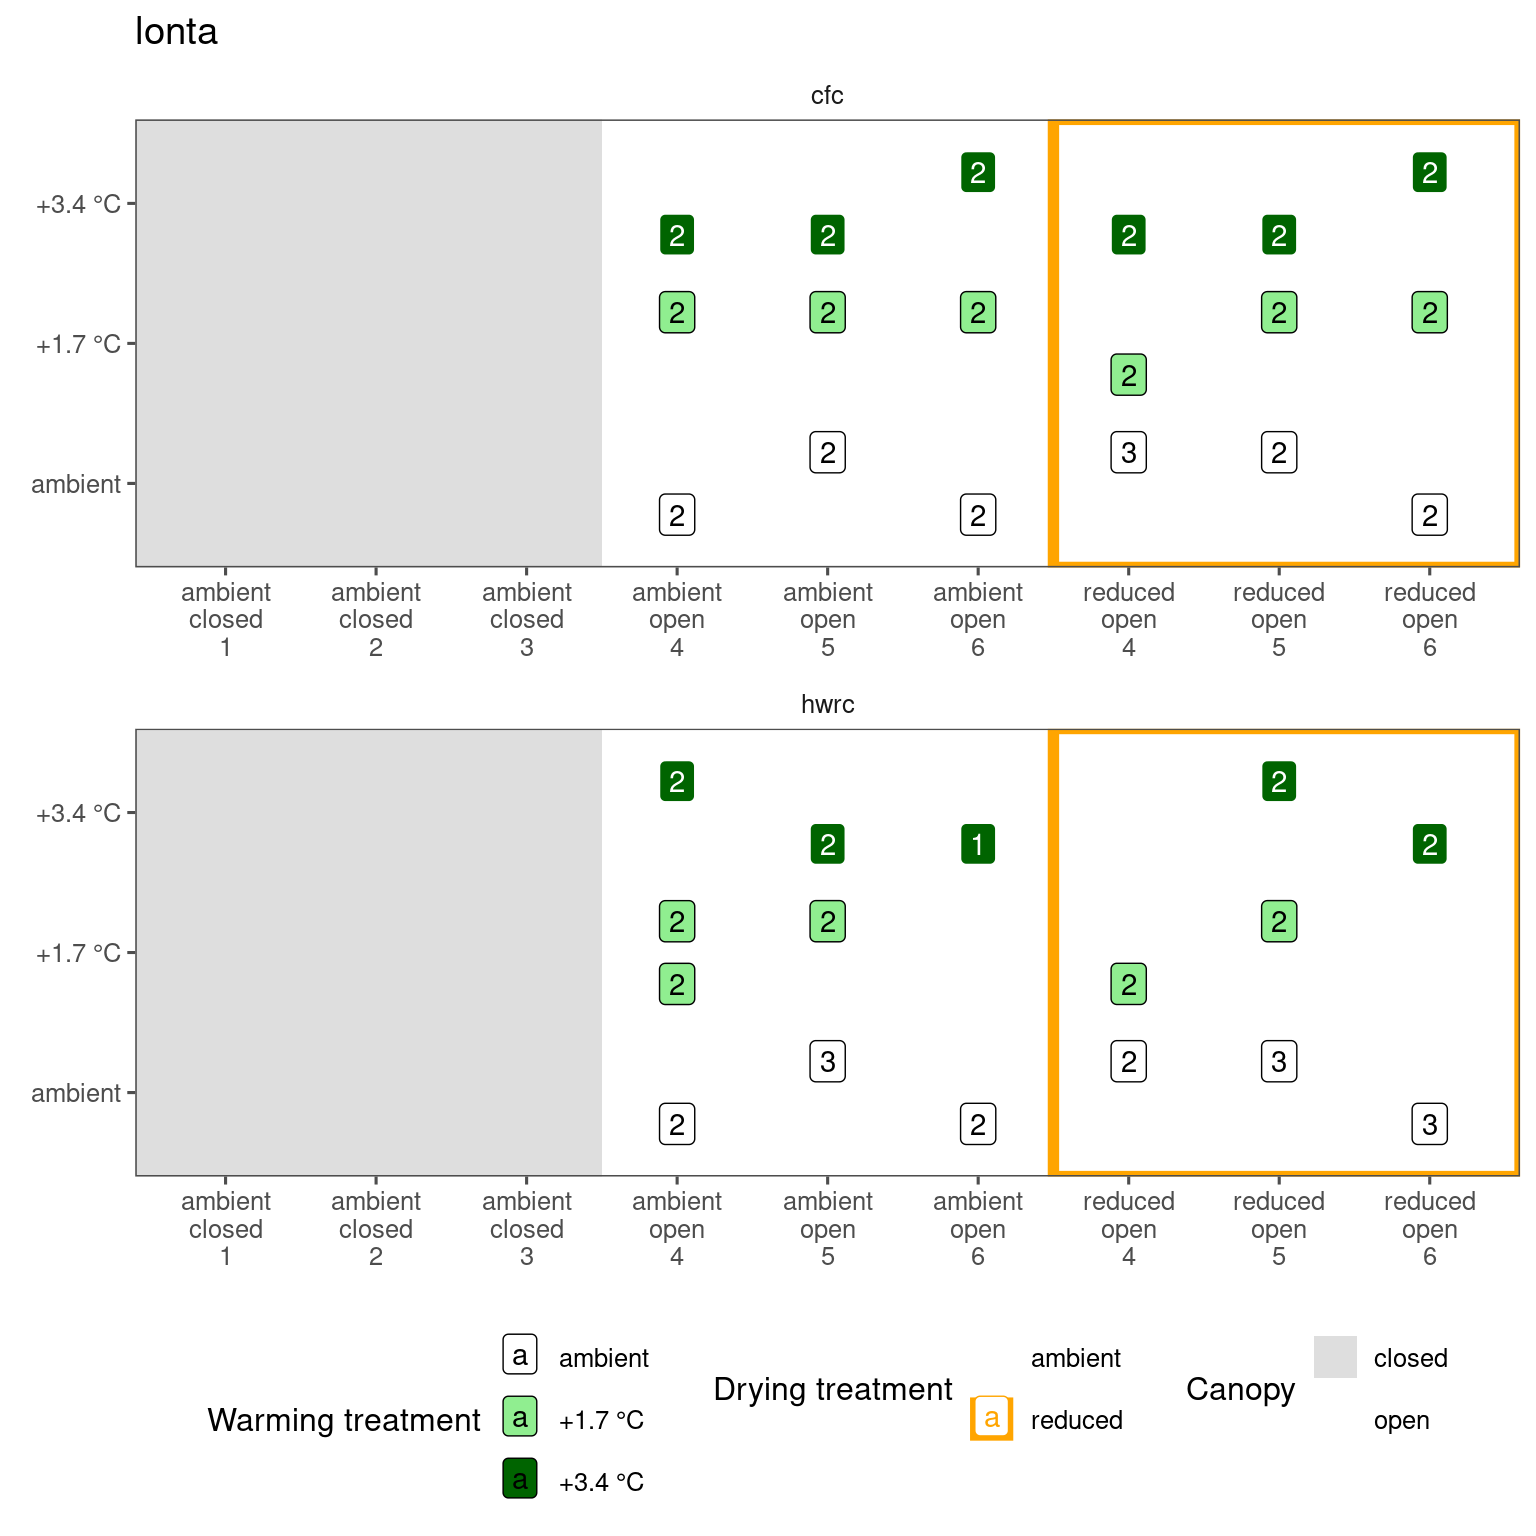
##
## [[8]]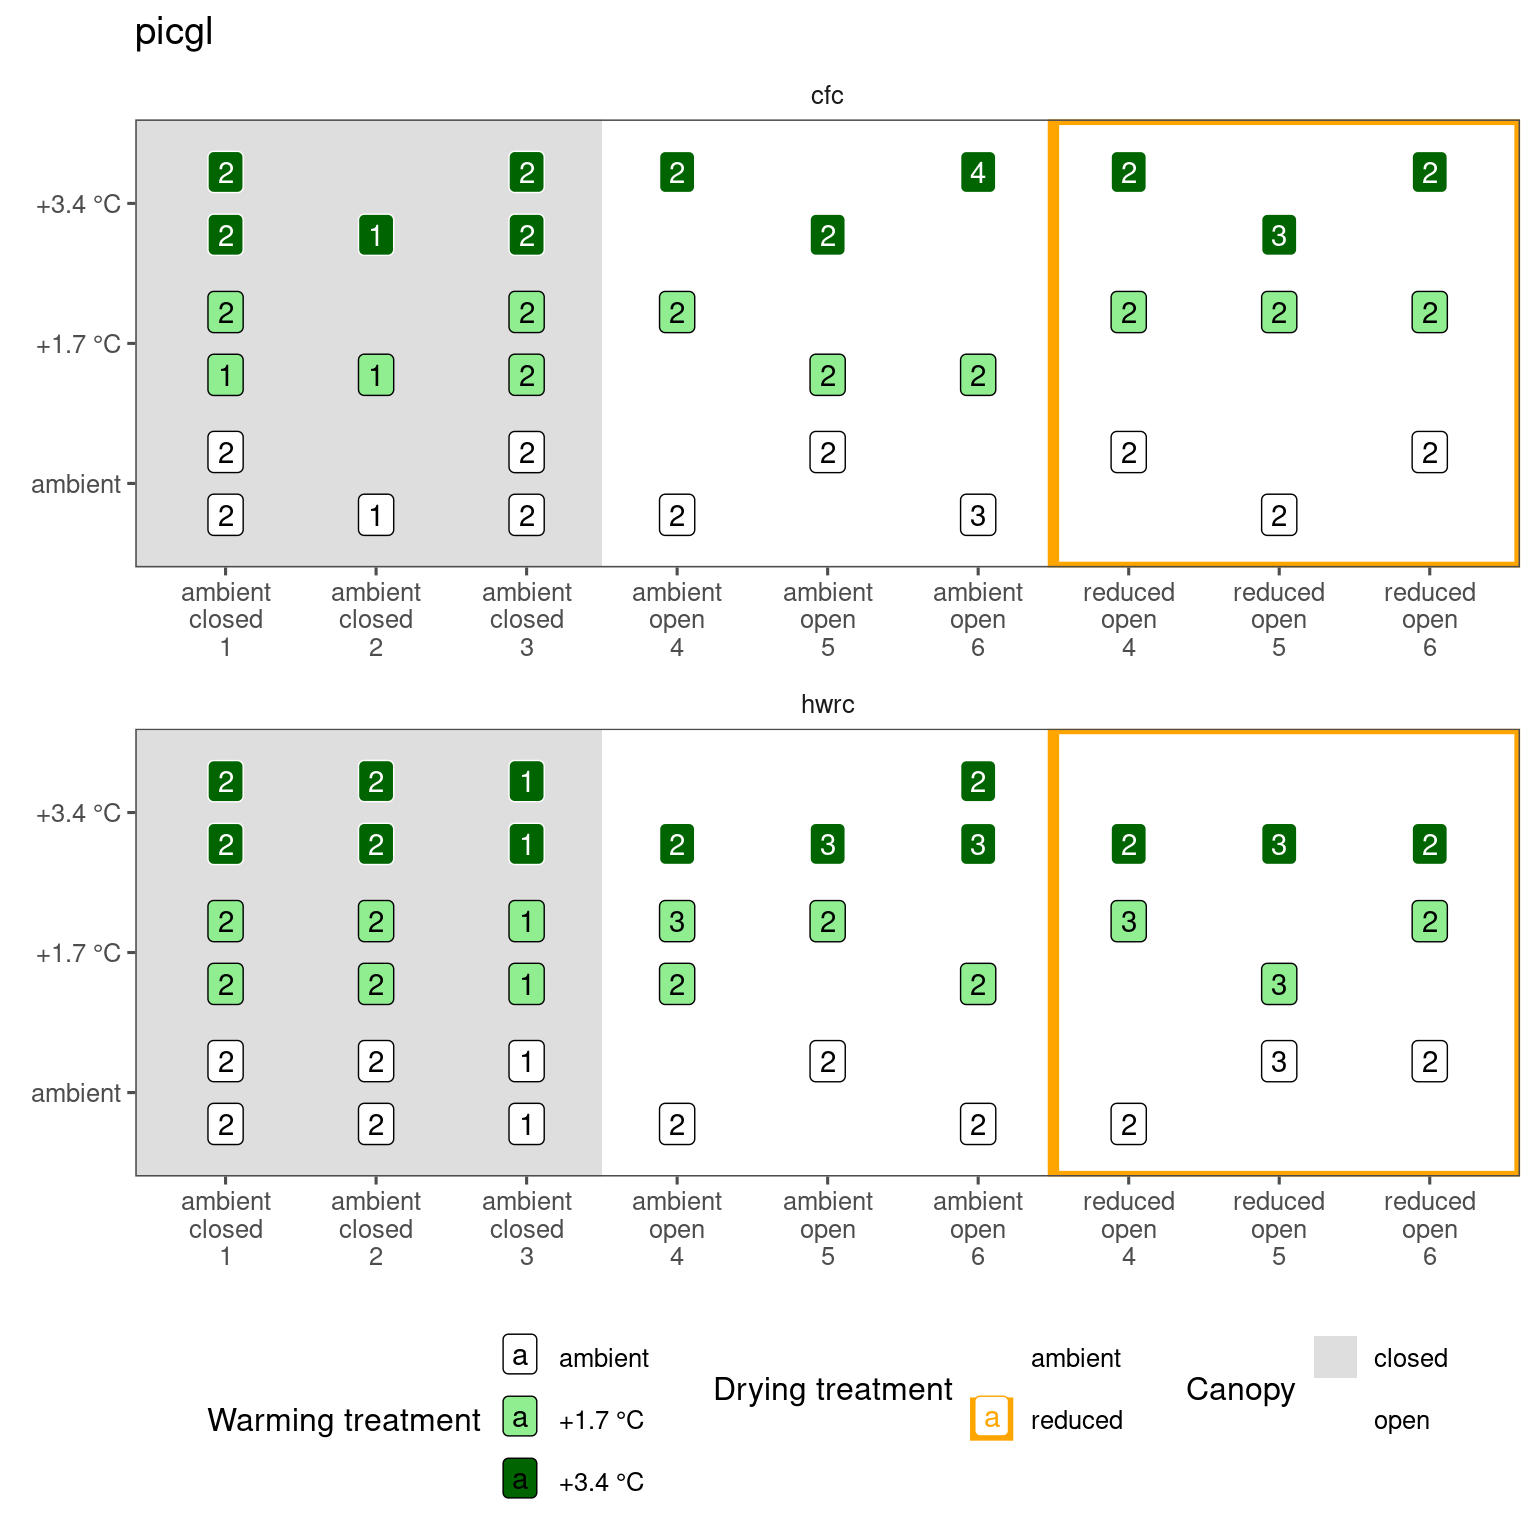
##
## [[9]]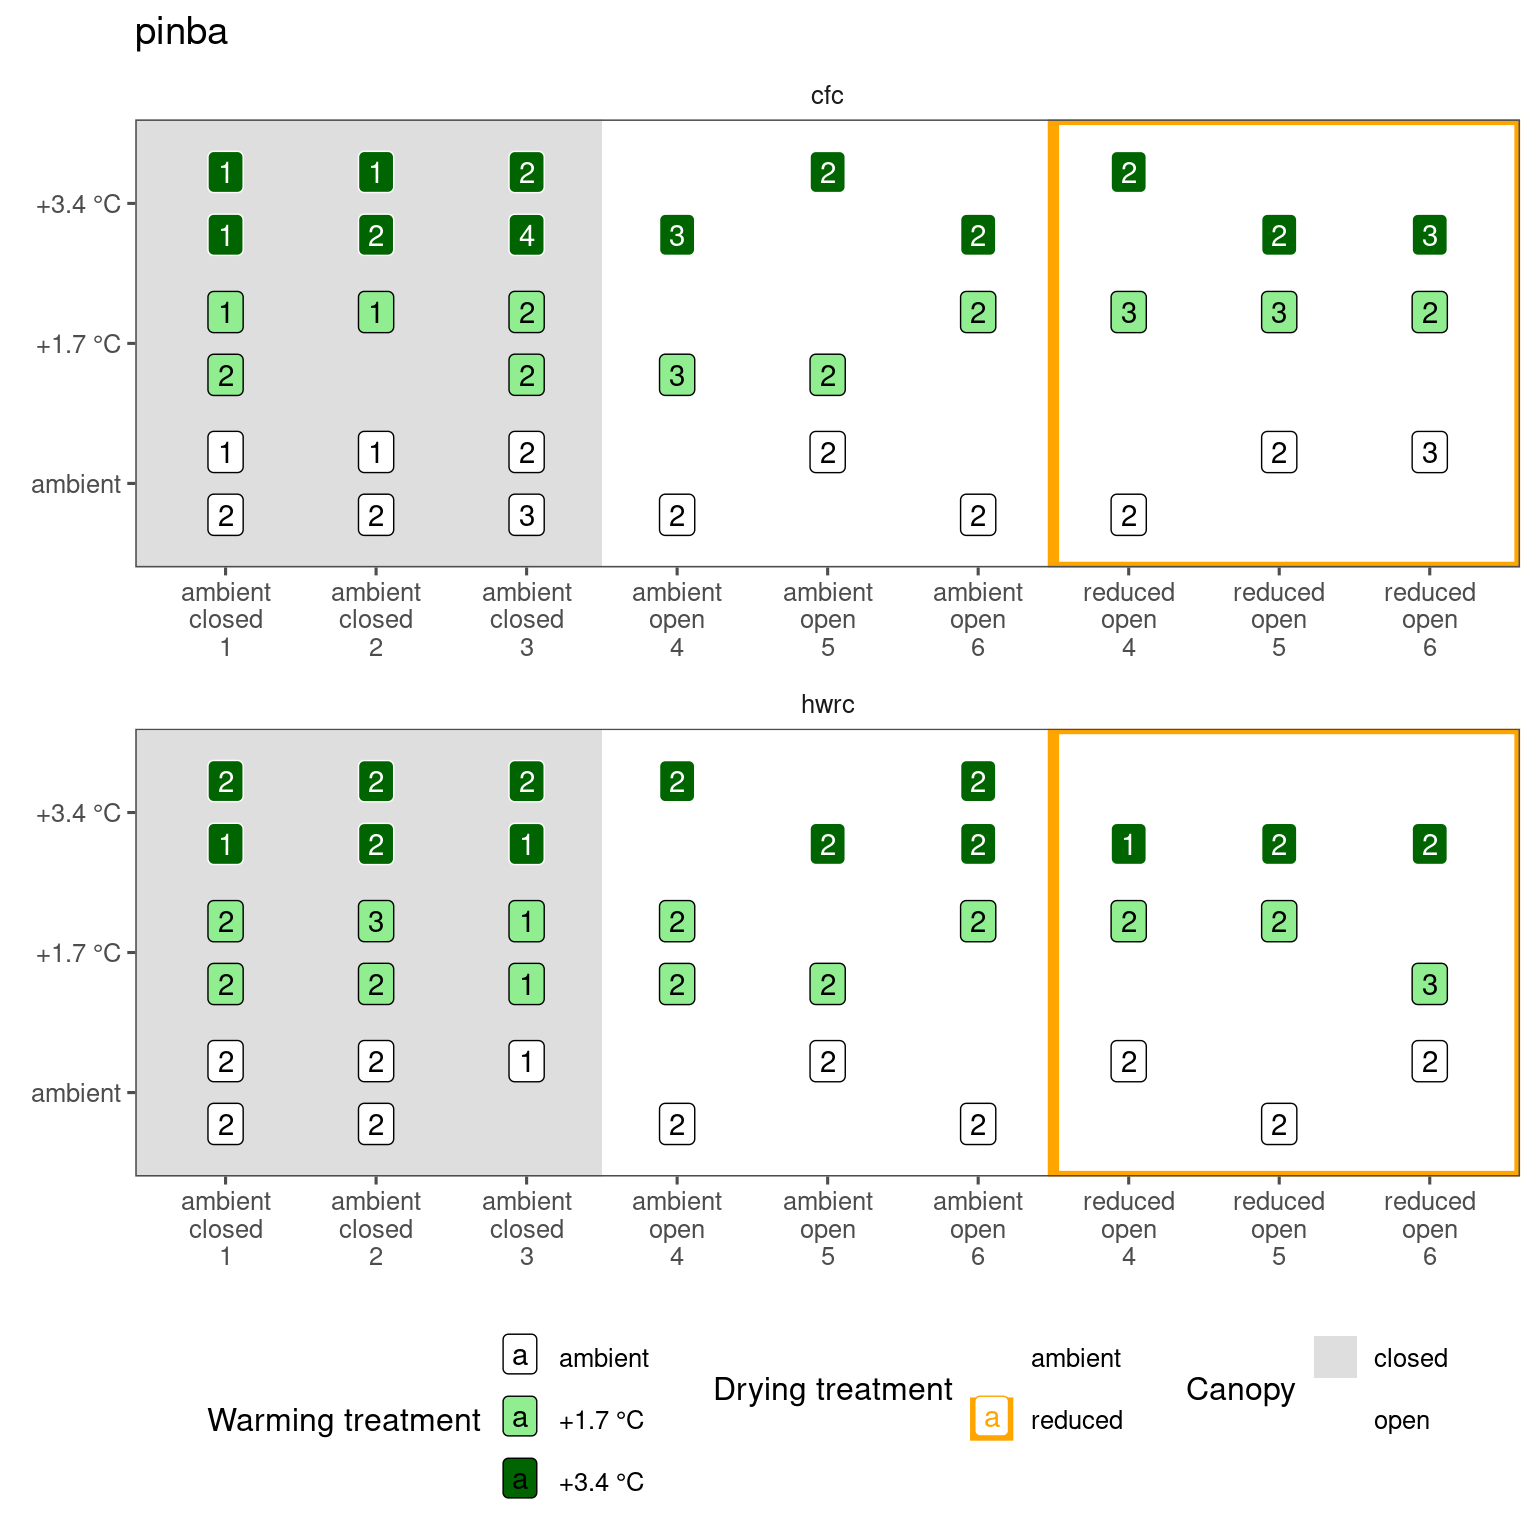
##
## [[10]]
##
## [[11]]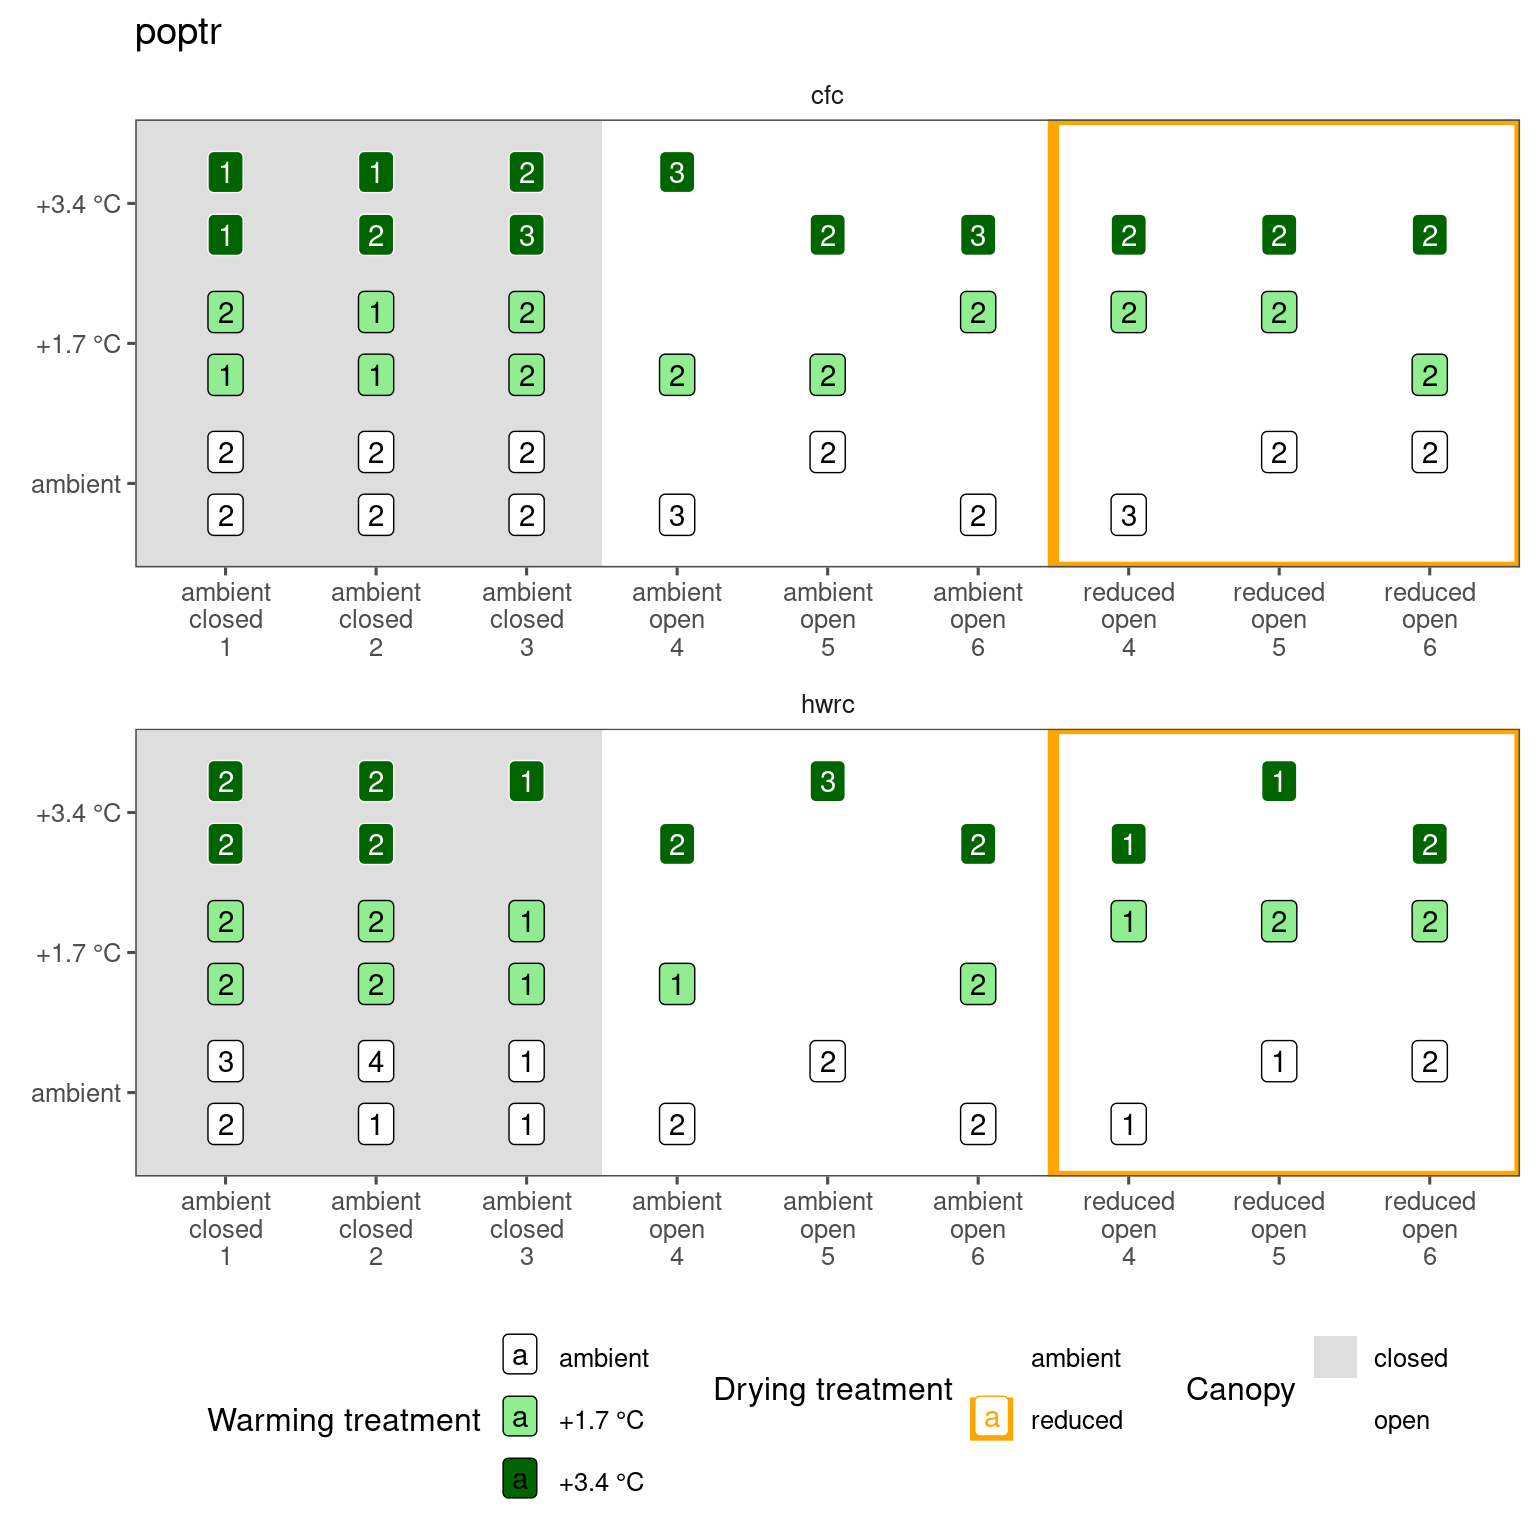
##
## [[12]]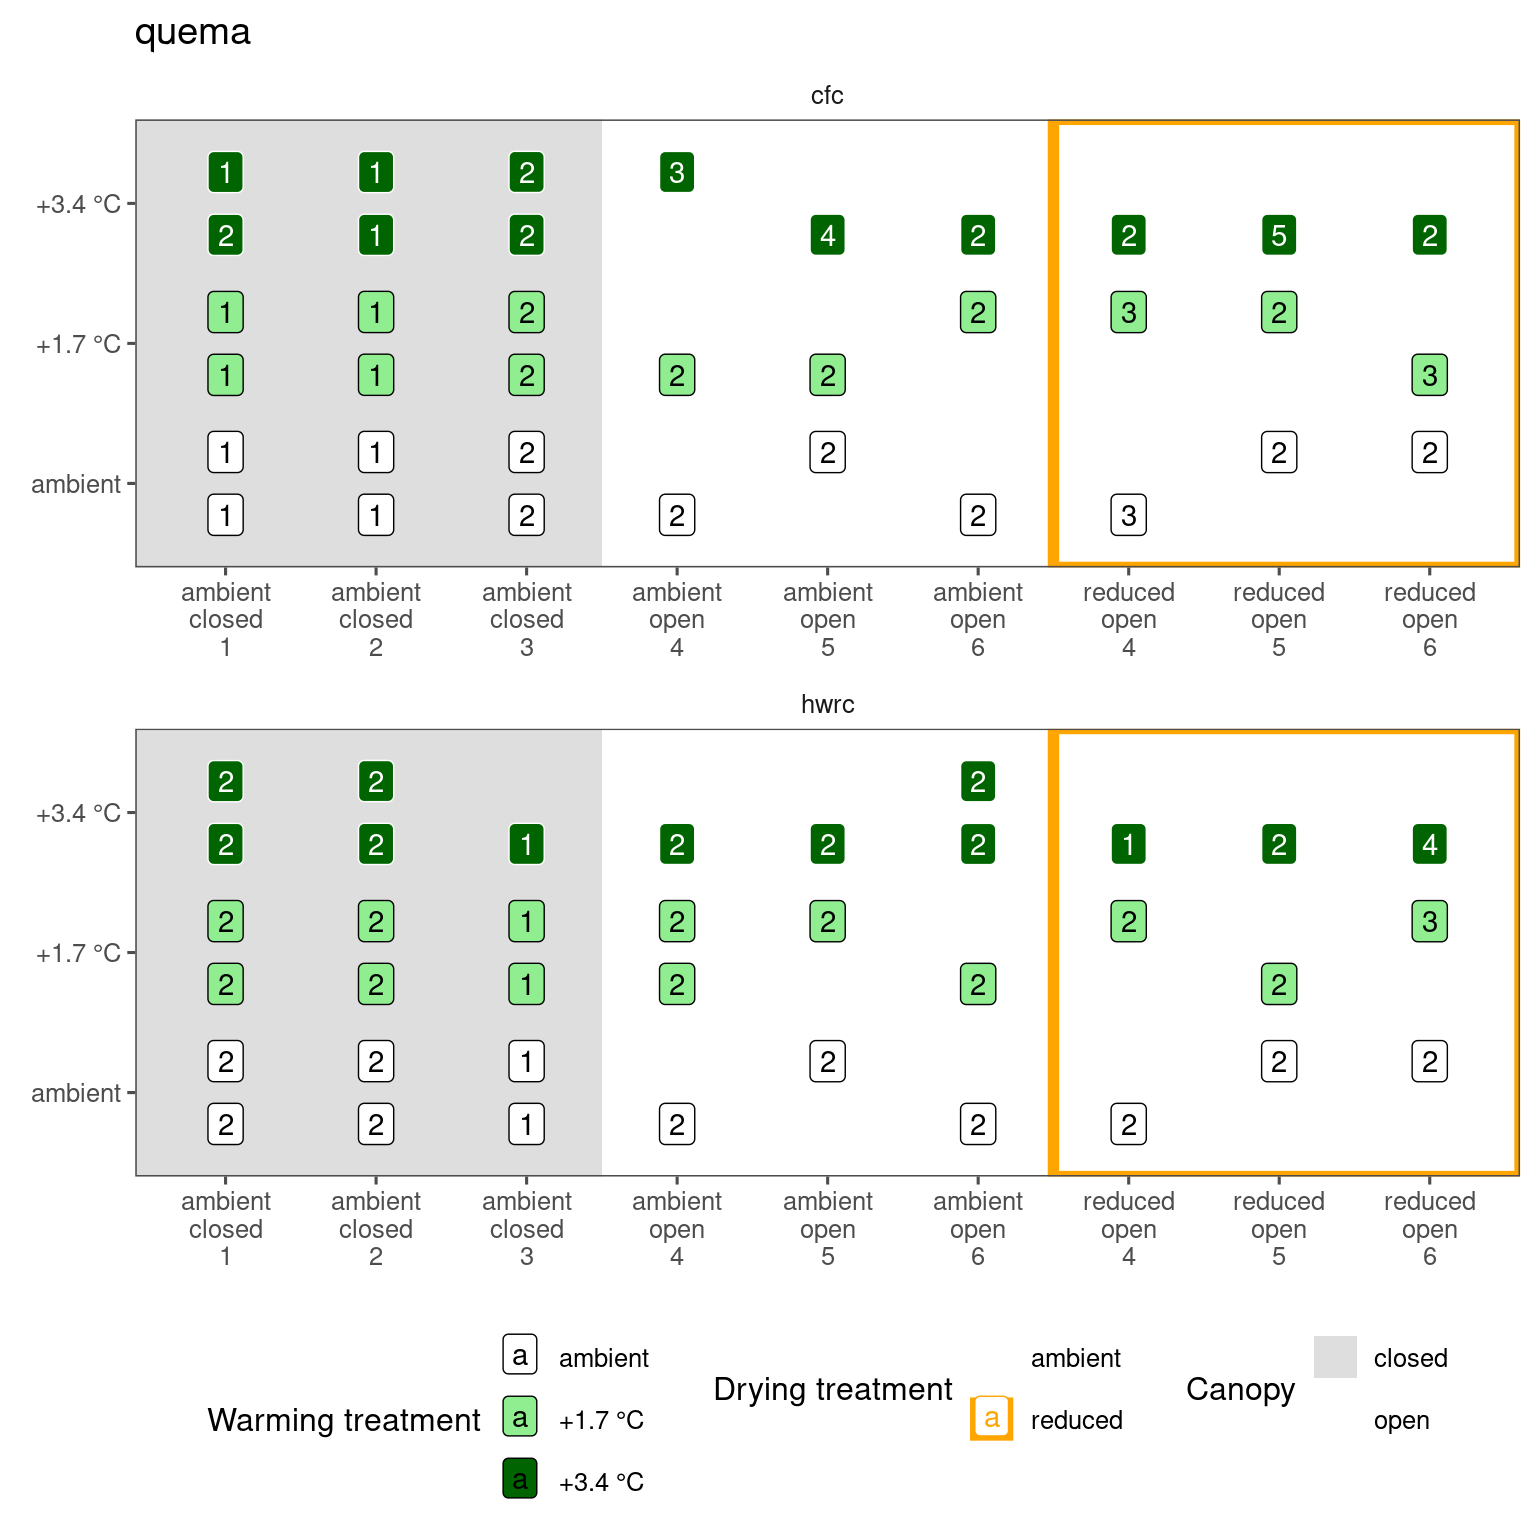
##
## [[13]]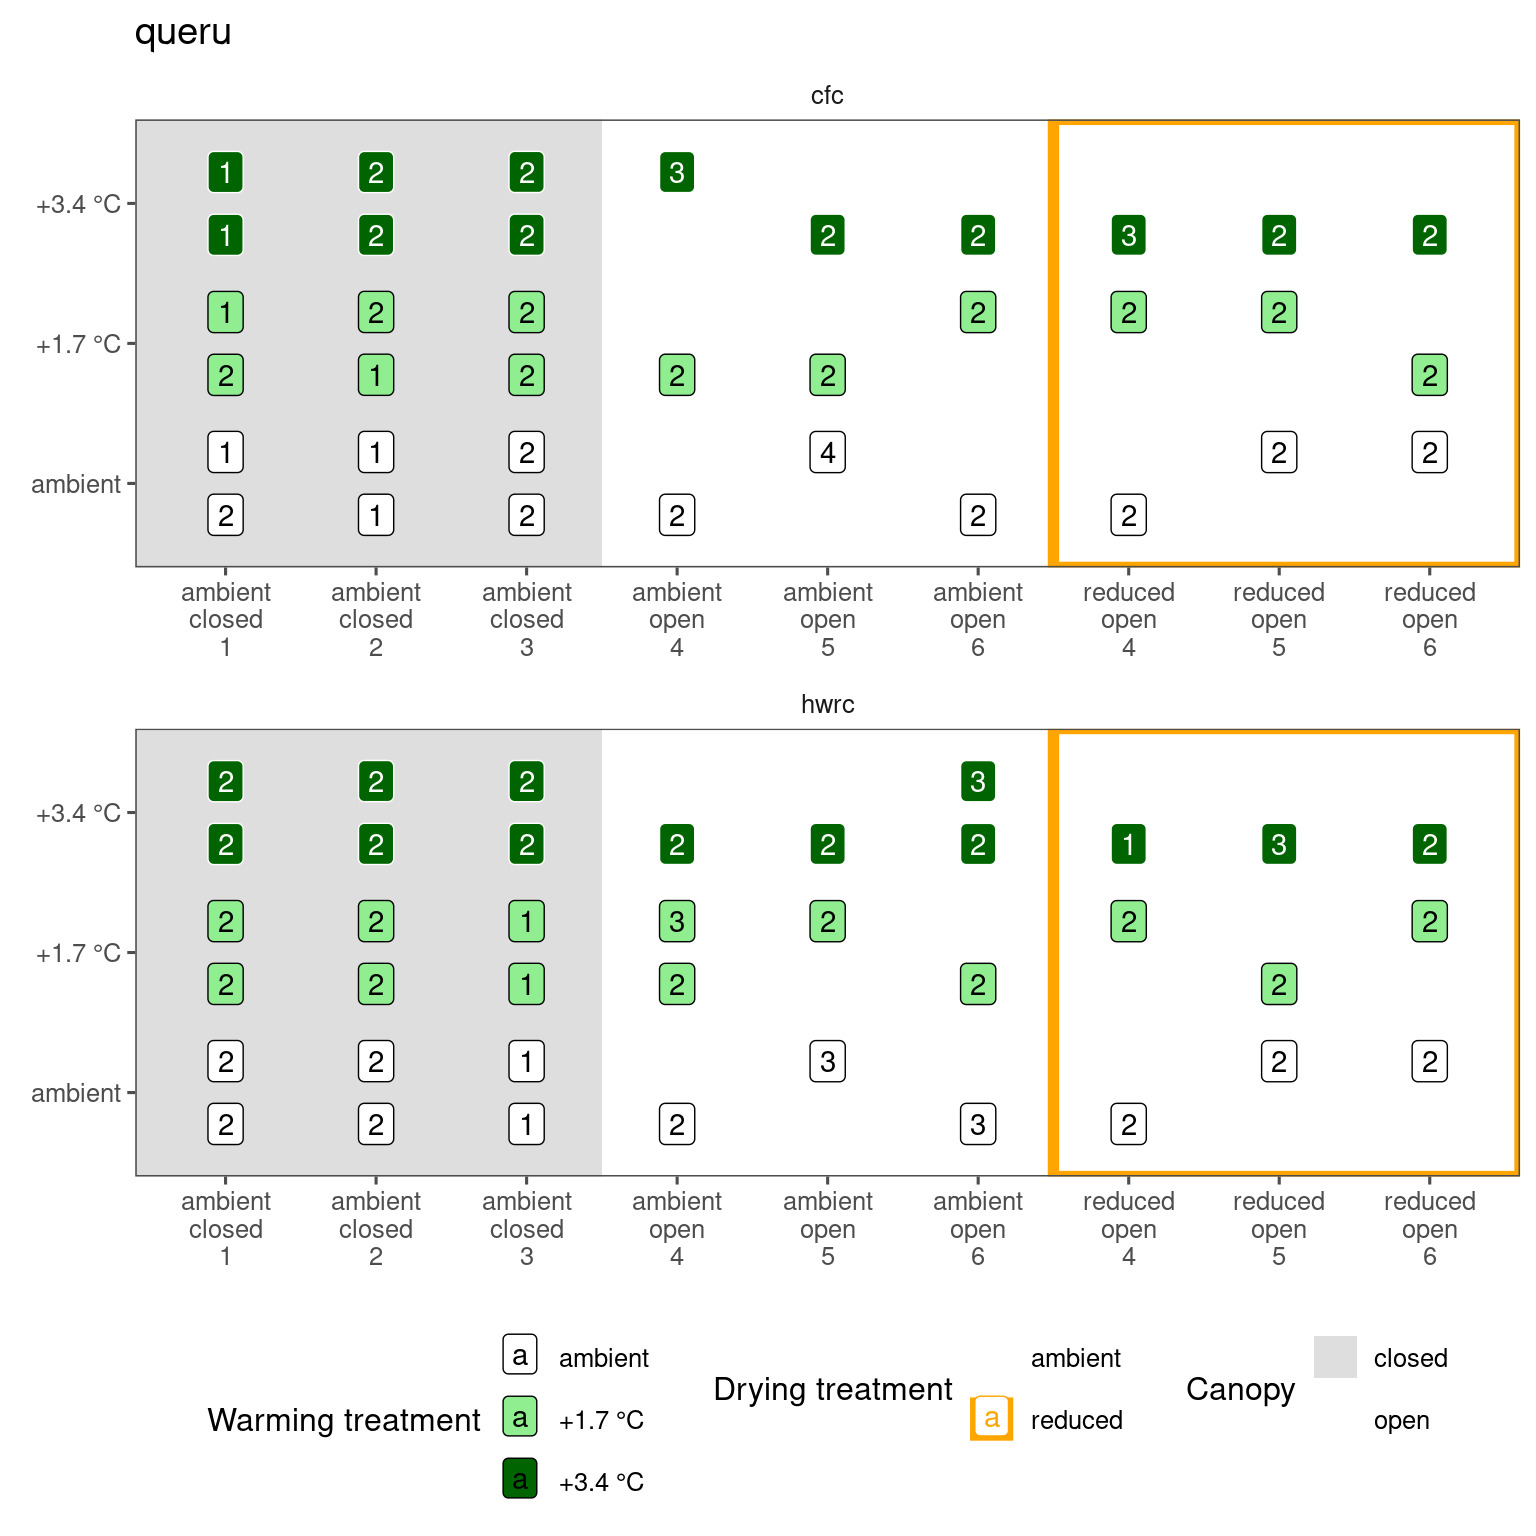
##
## [[14]]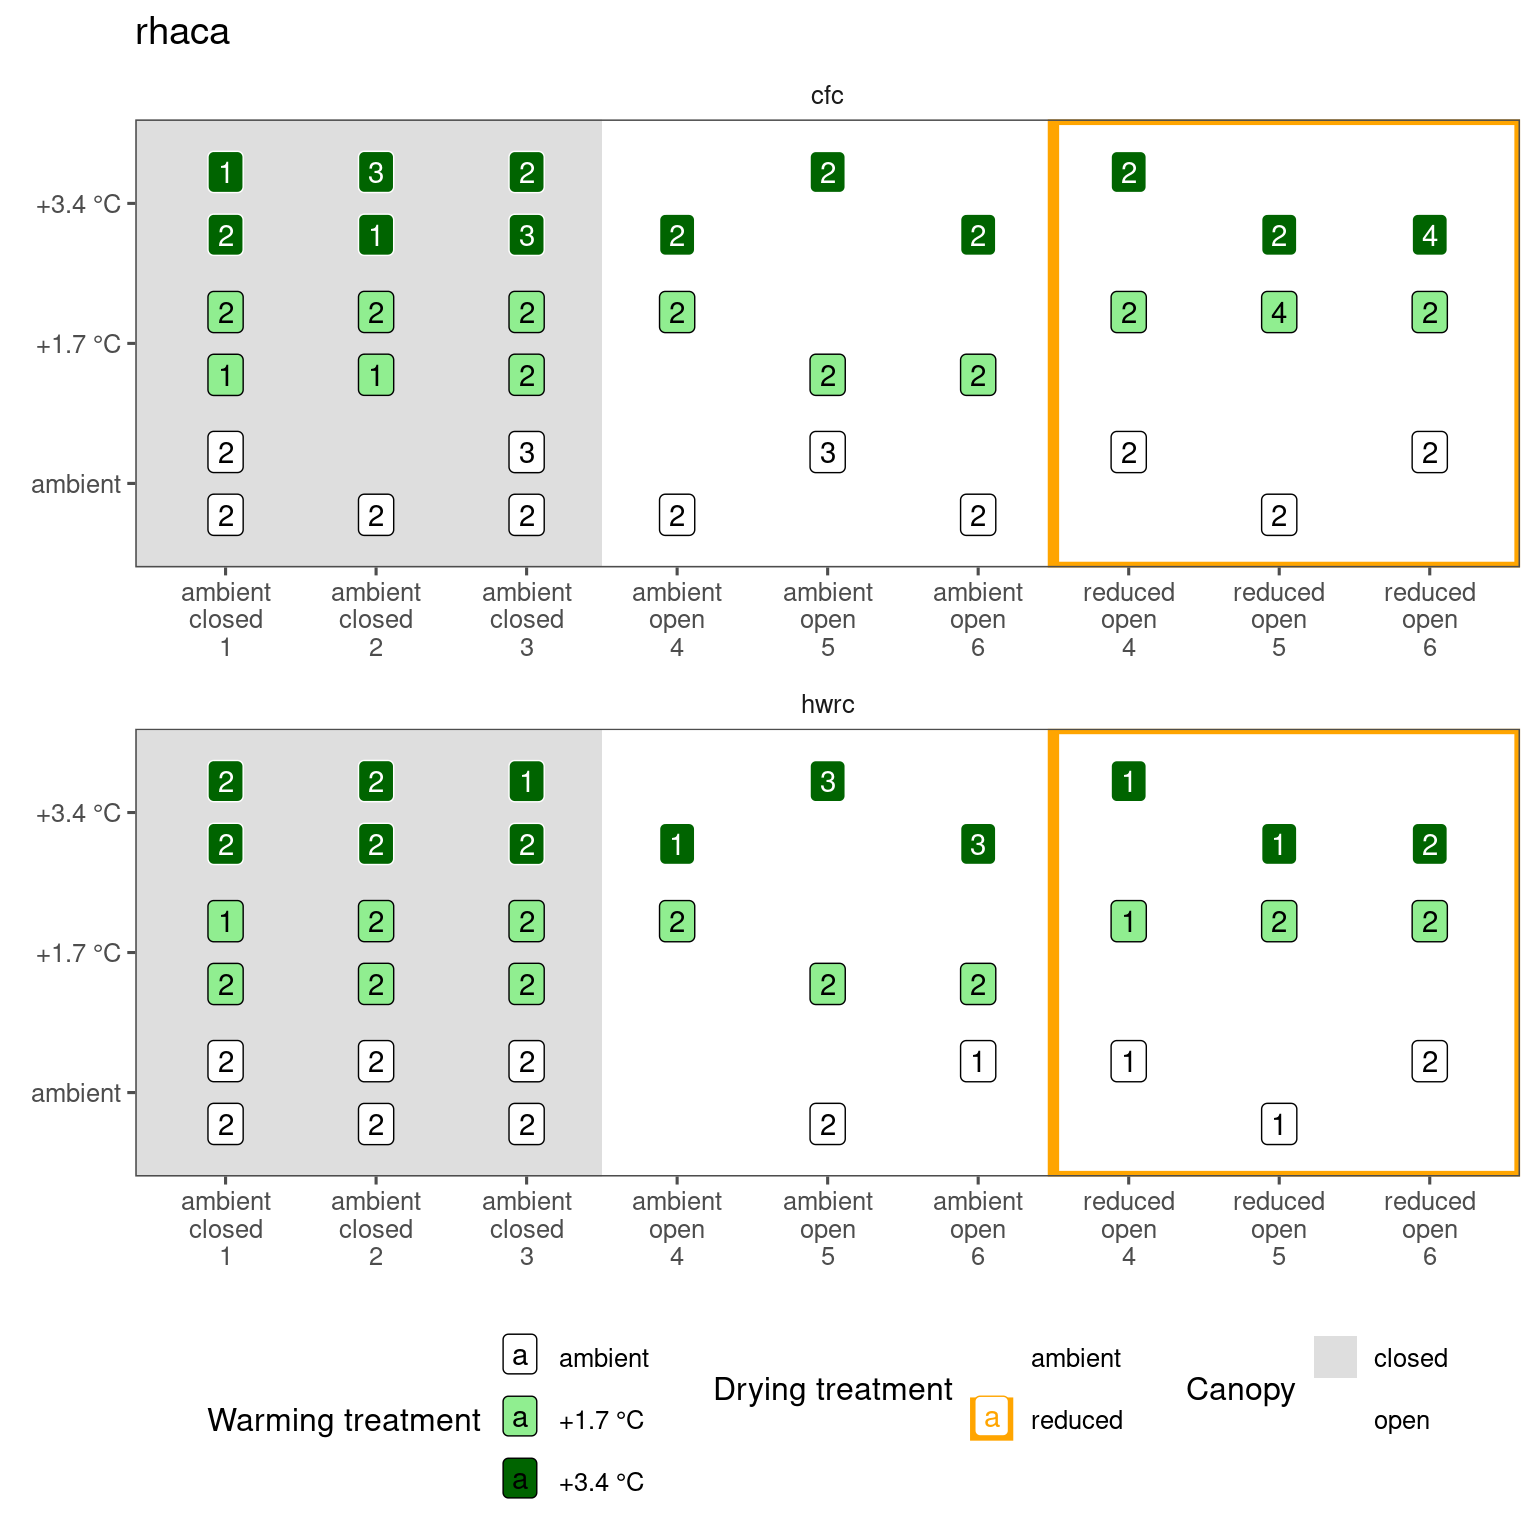
##
## [[15]]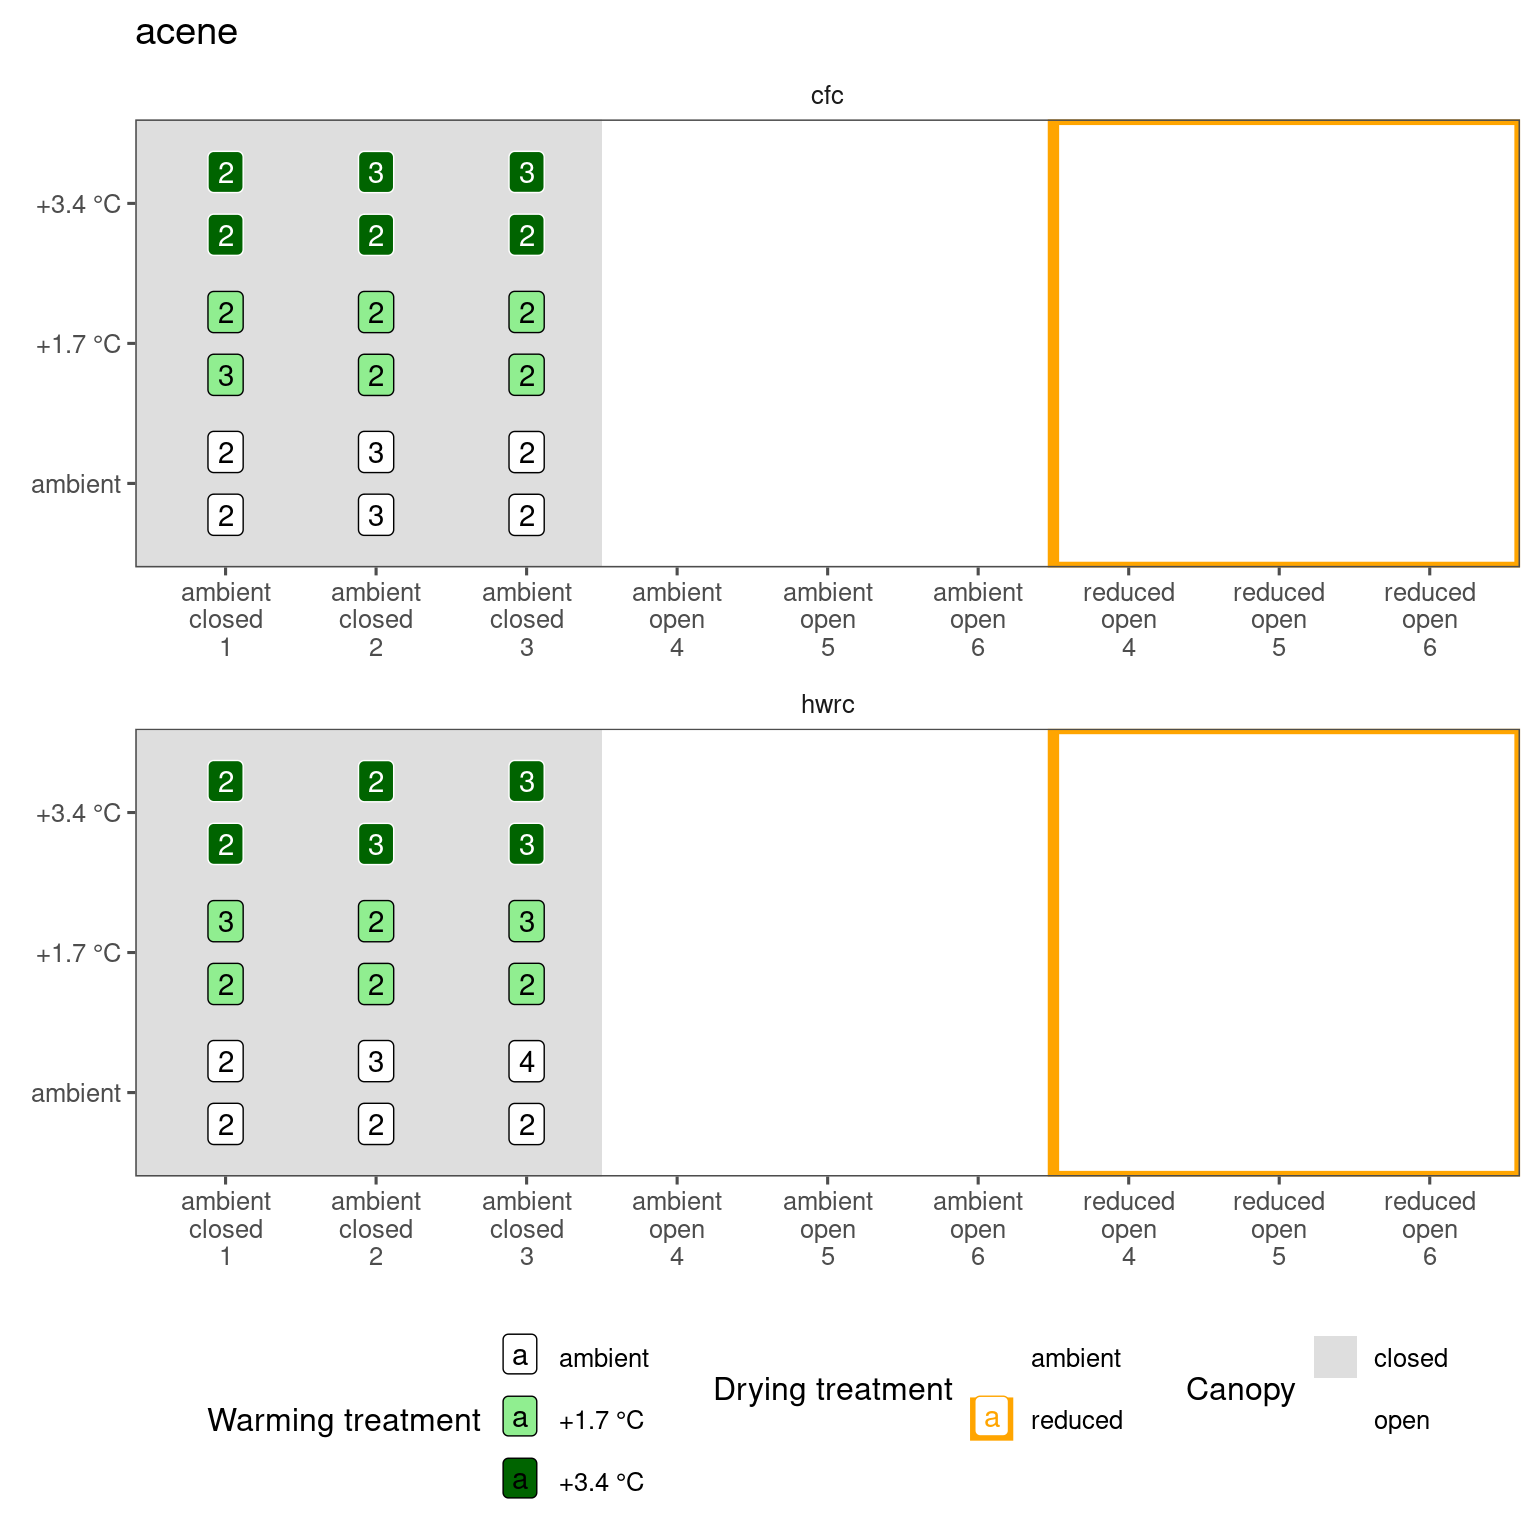
##
## [[16]]
##
## [[17]]
##
## [[18]]
##
## [[19]]
##
## [[20]]