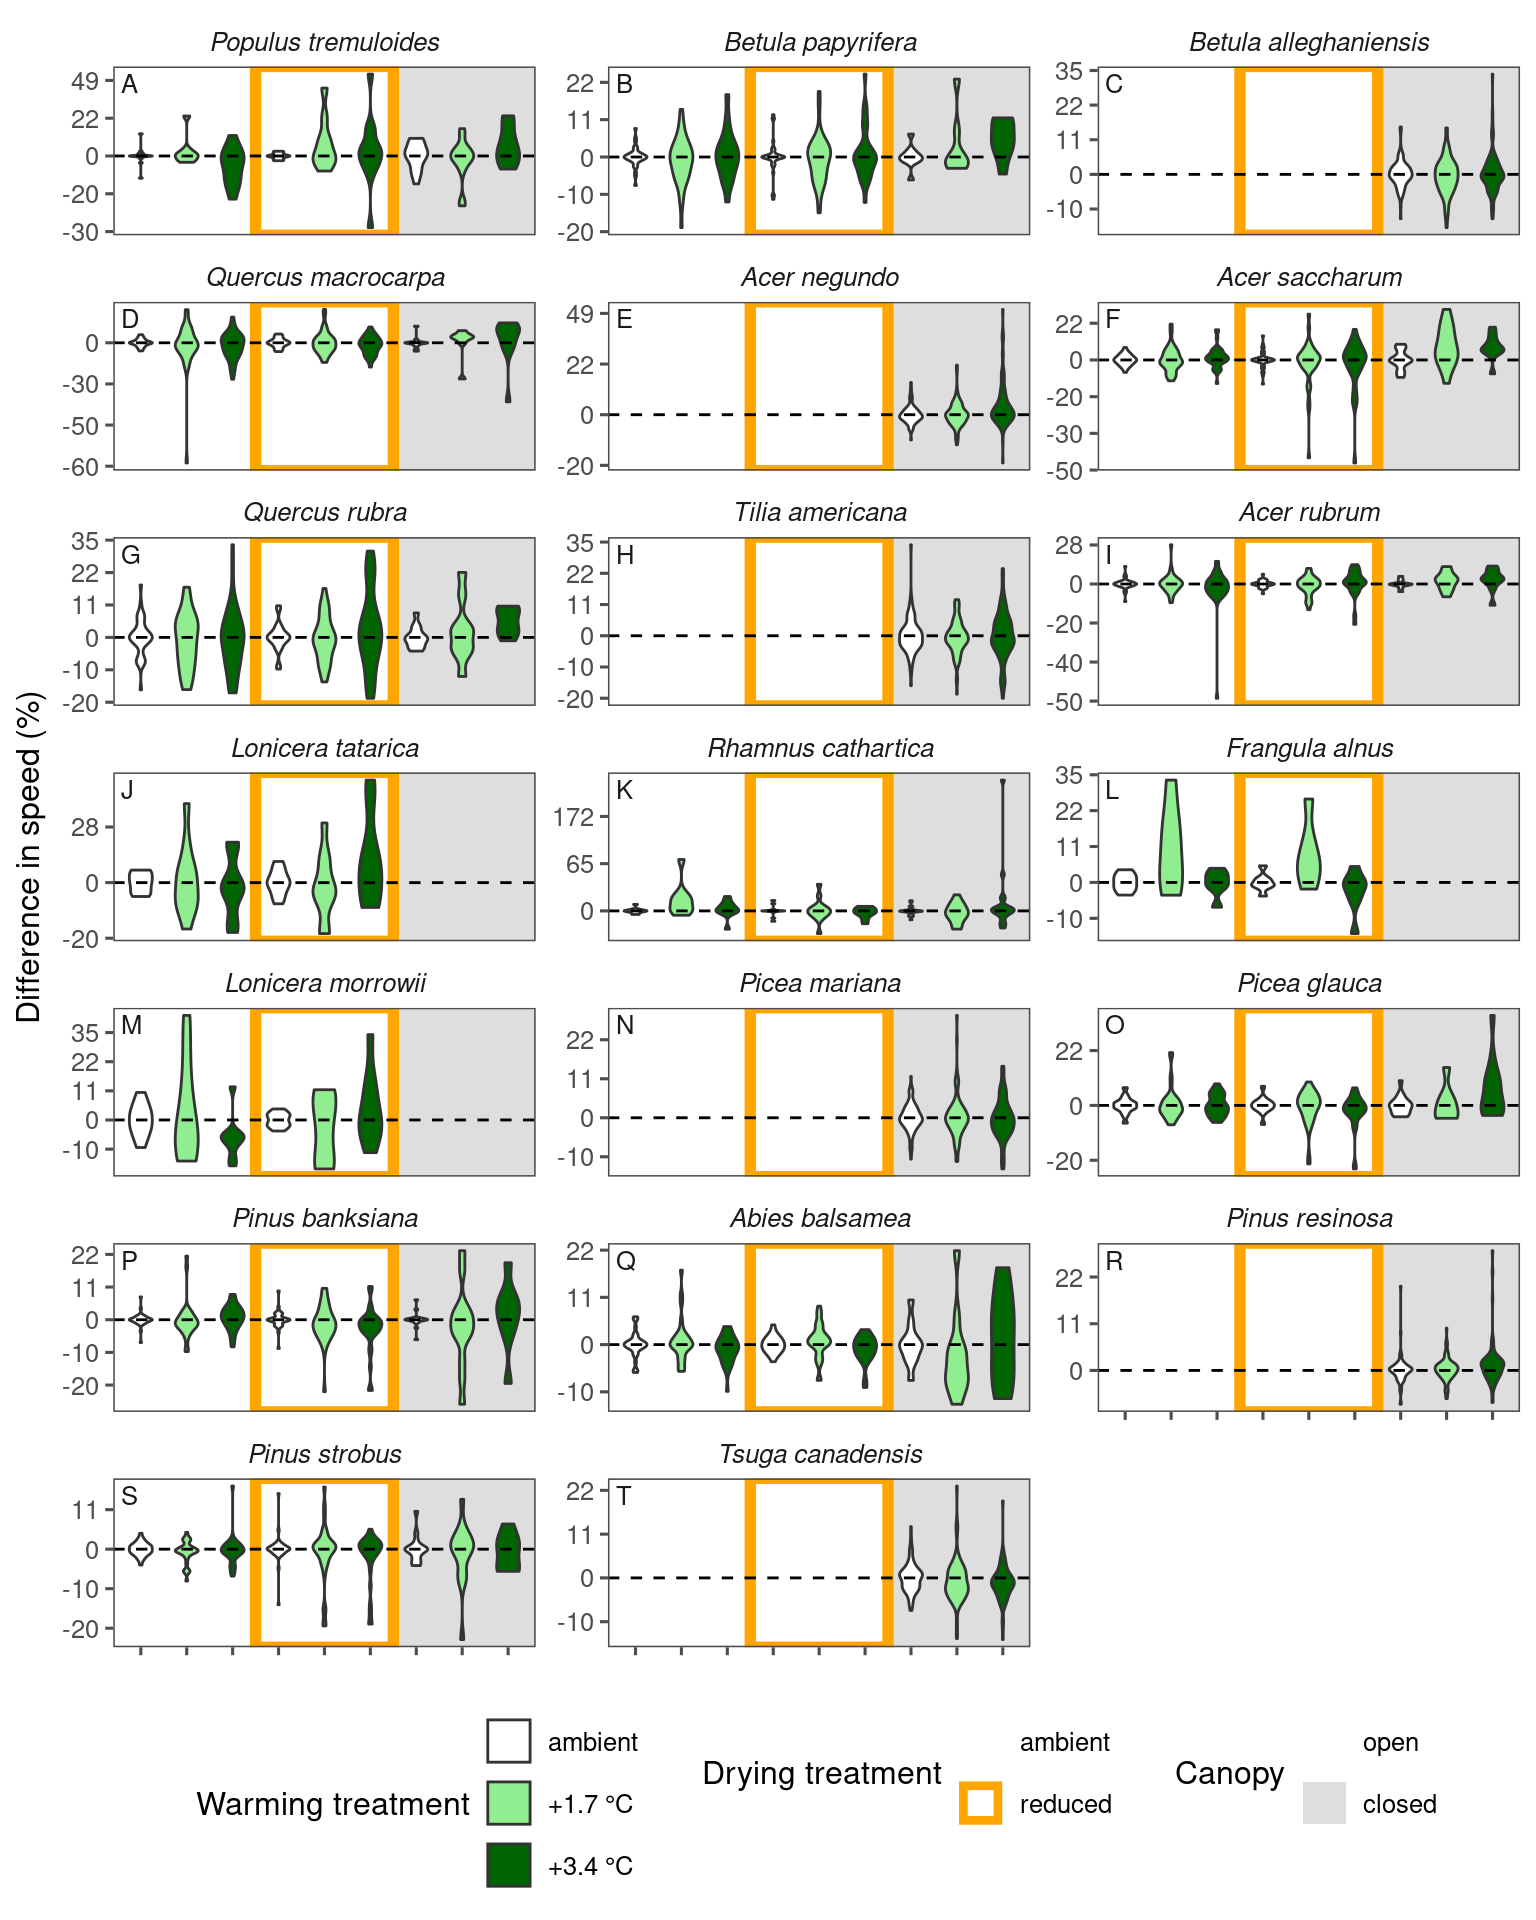
Visualize differences between treatments
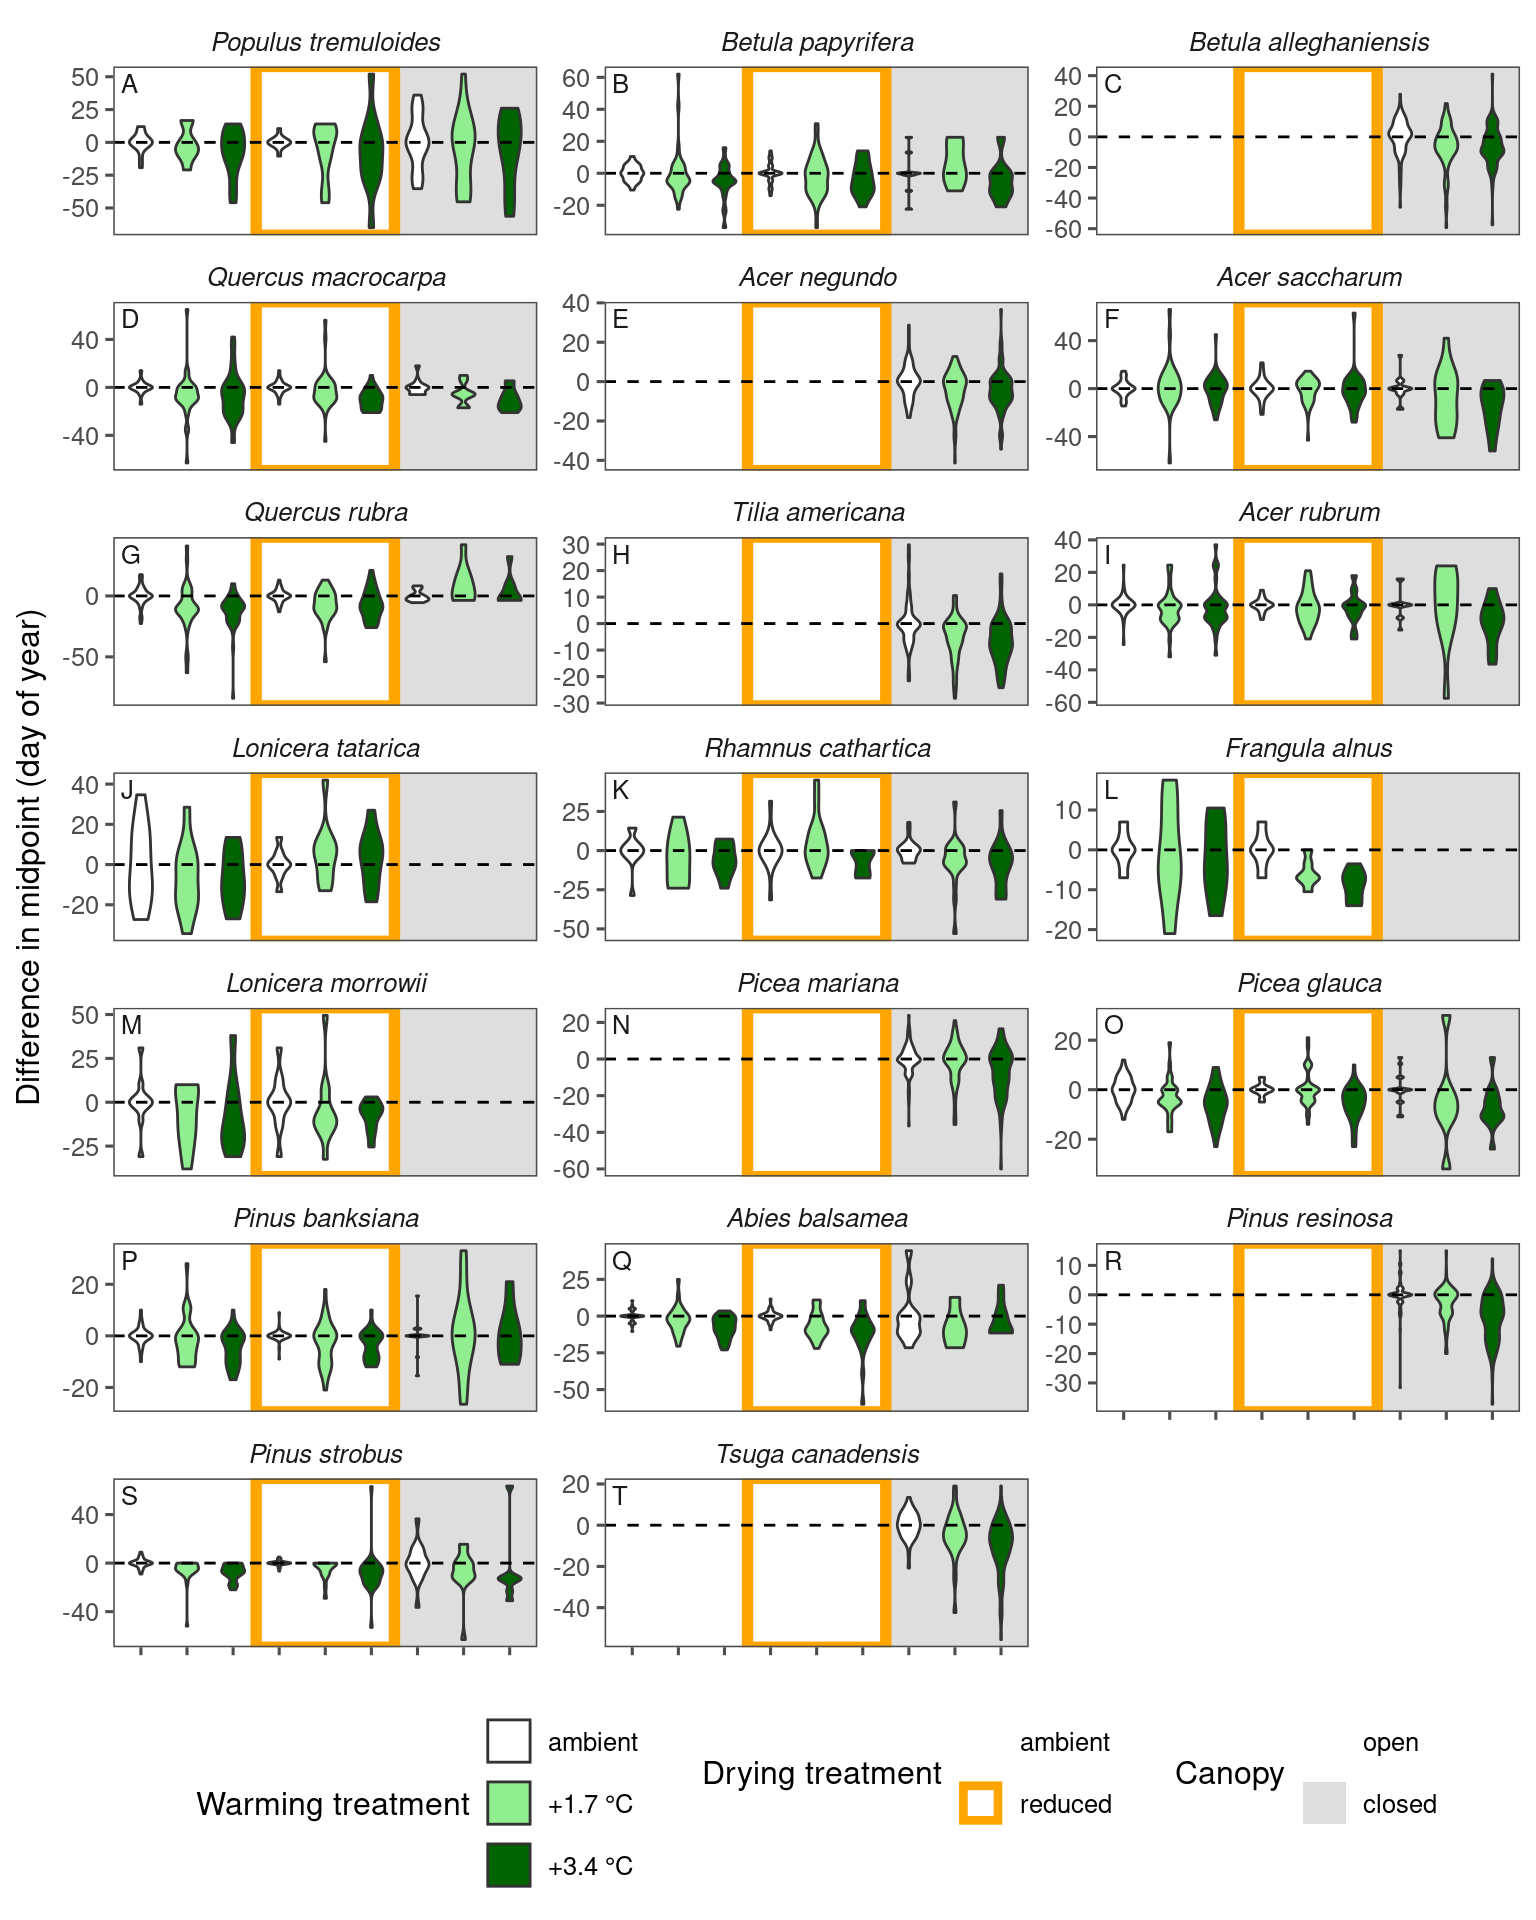
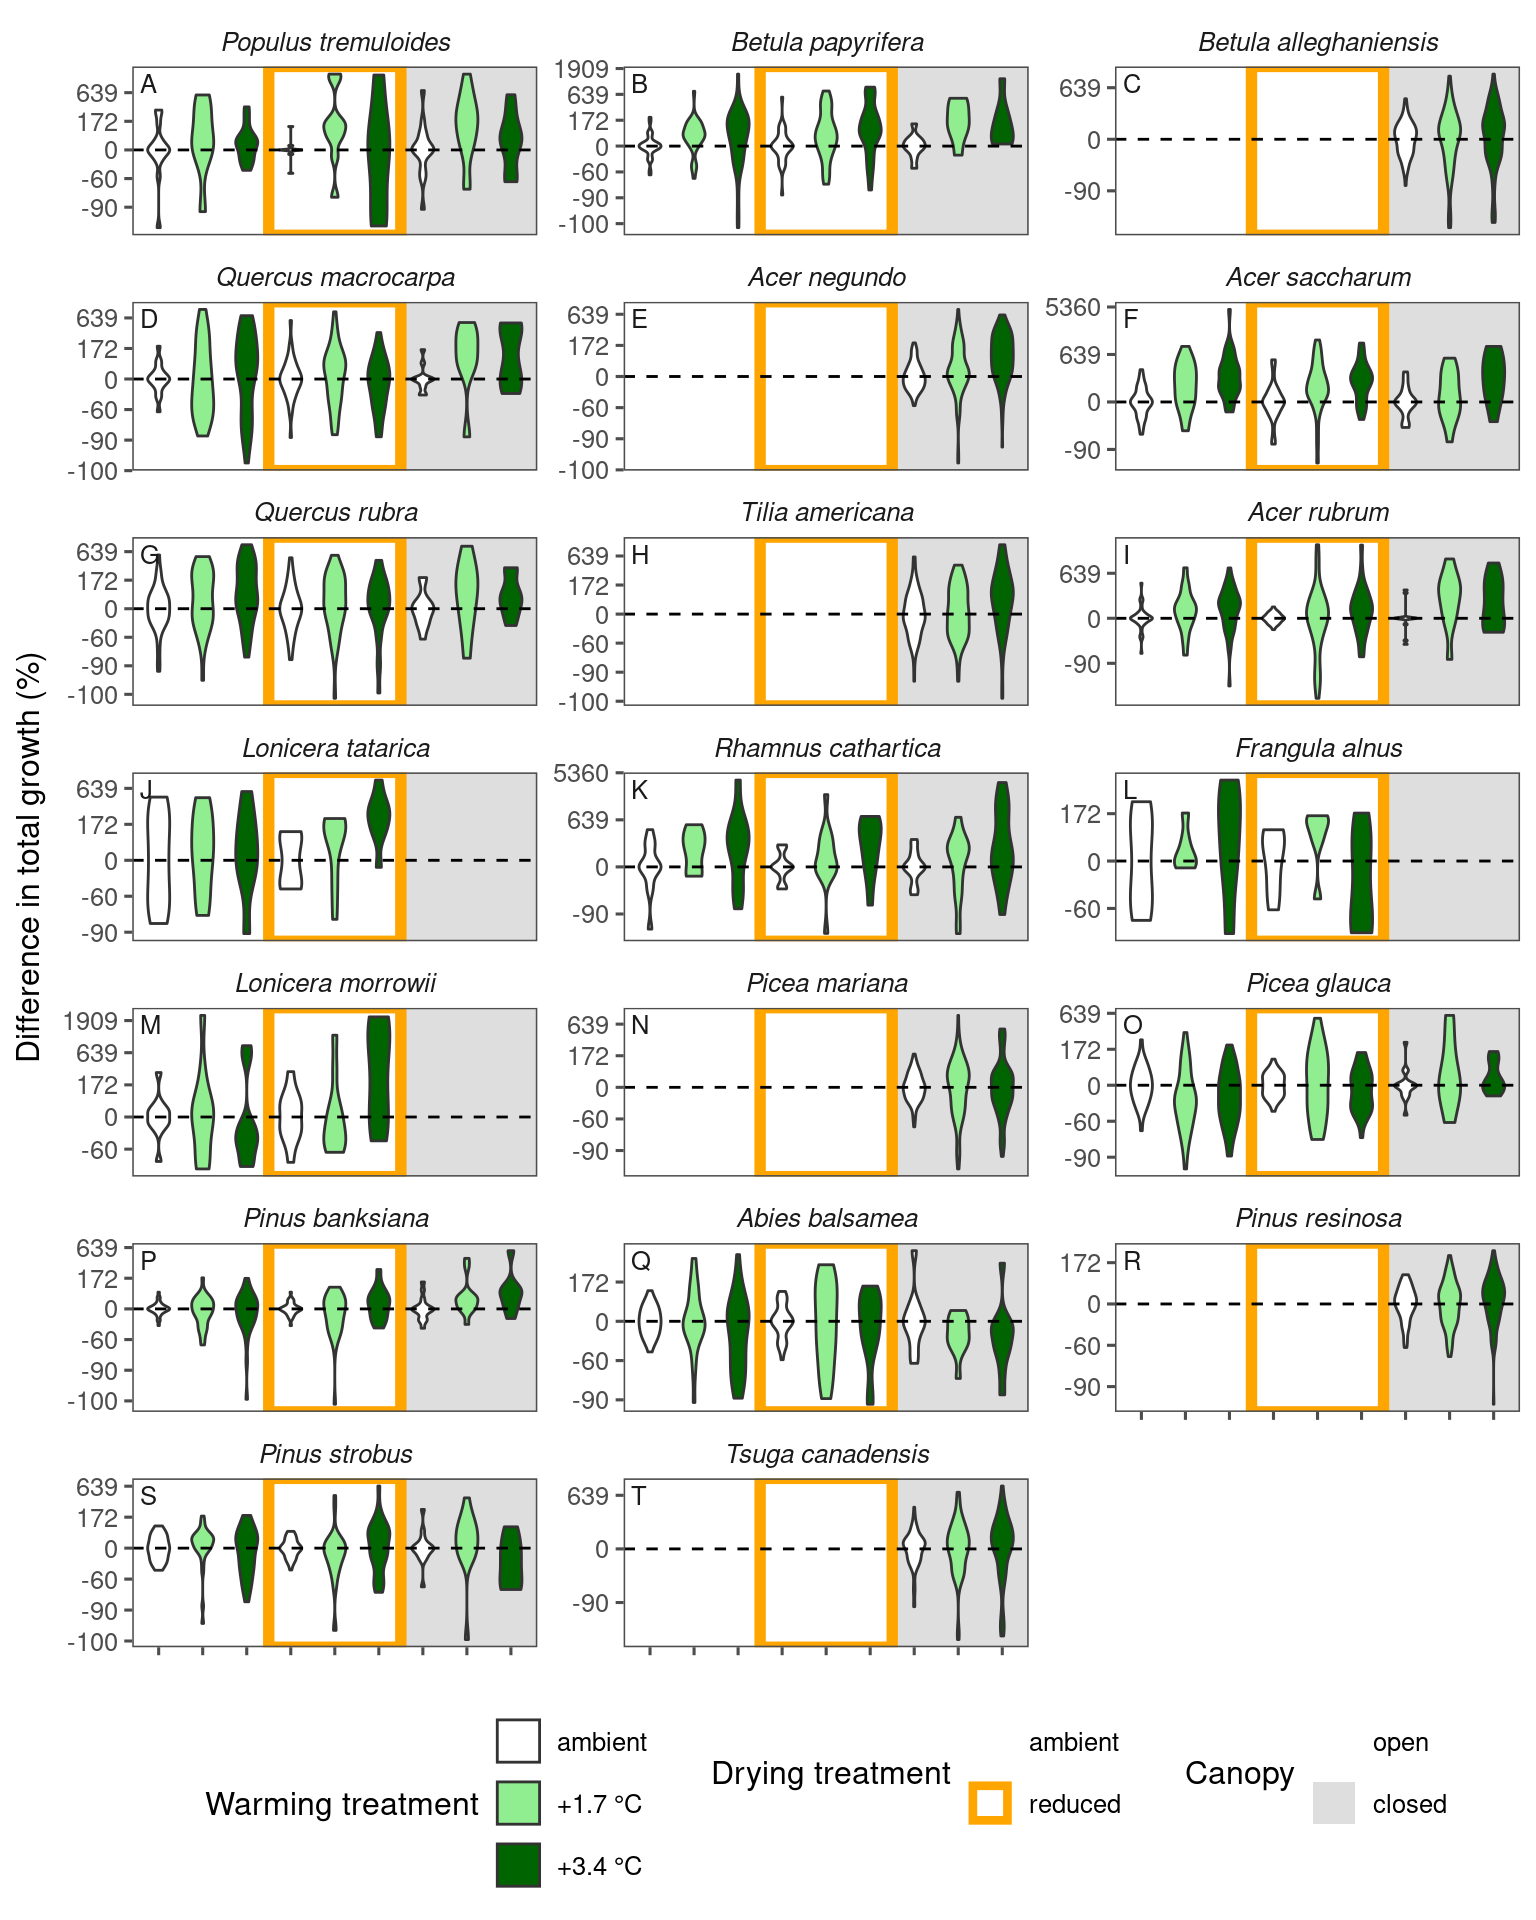
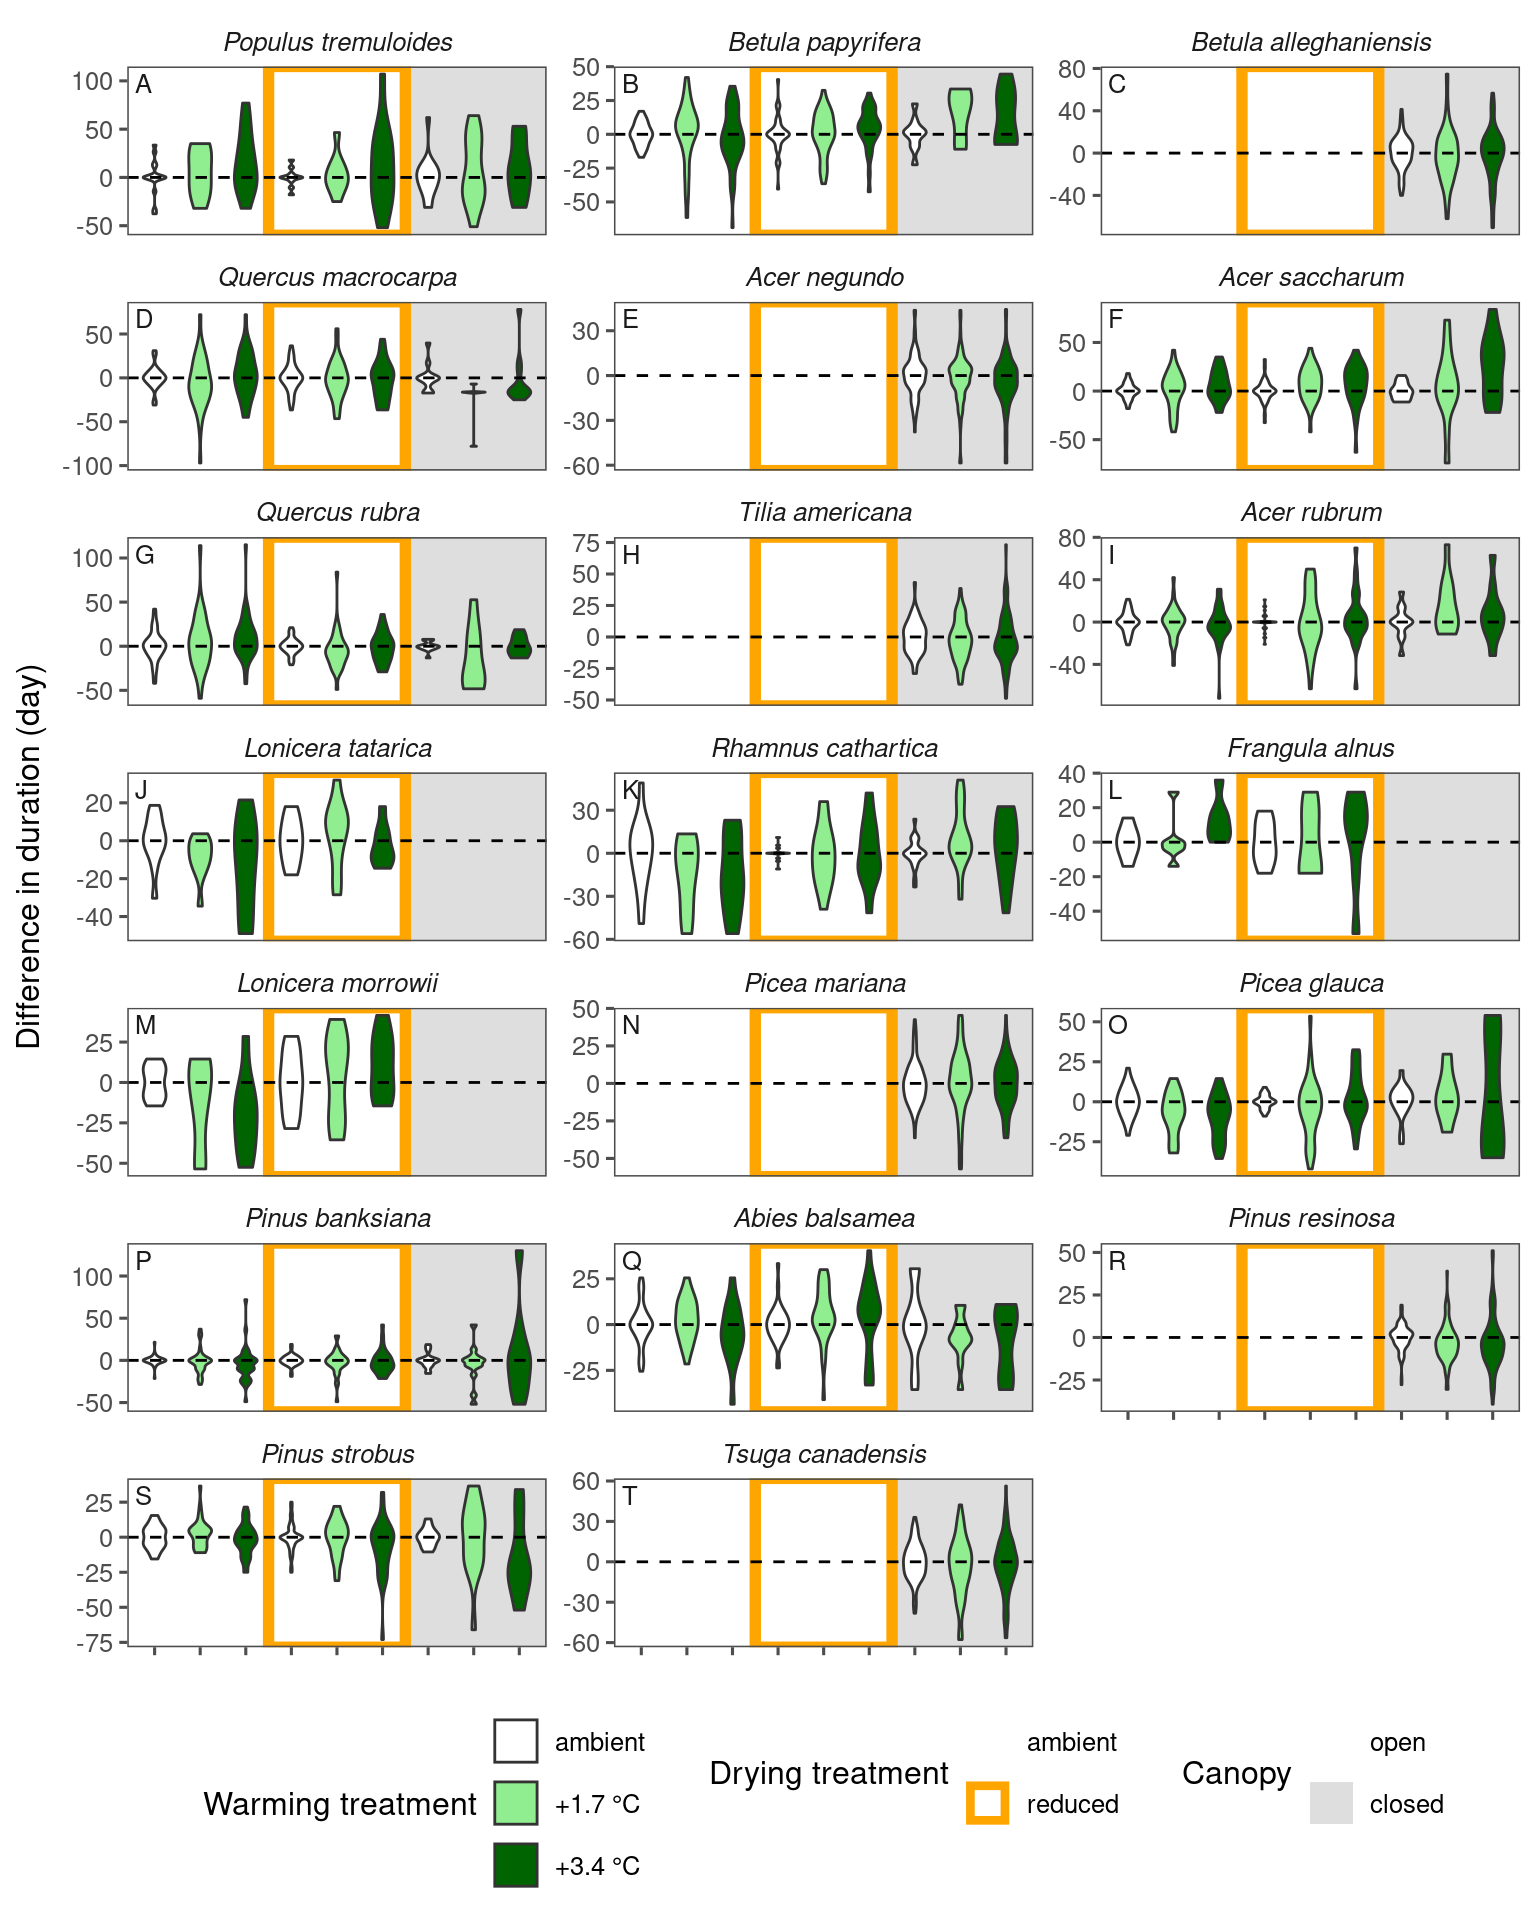
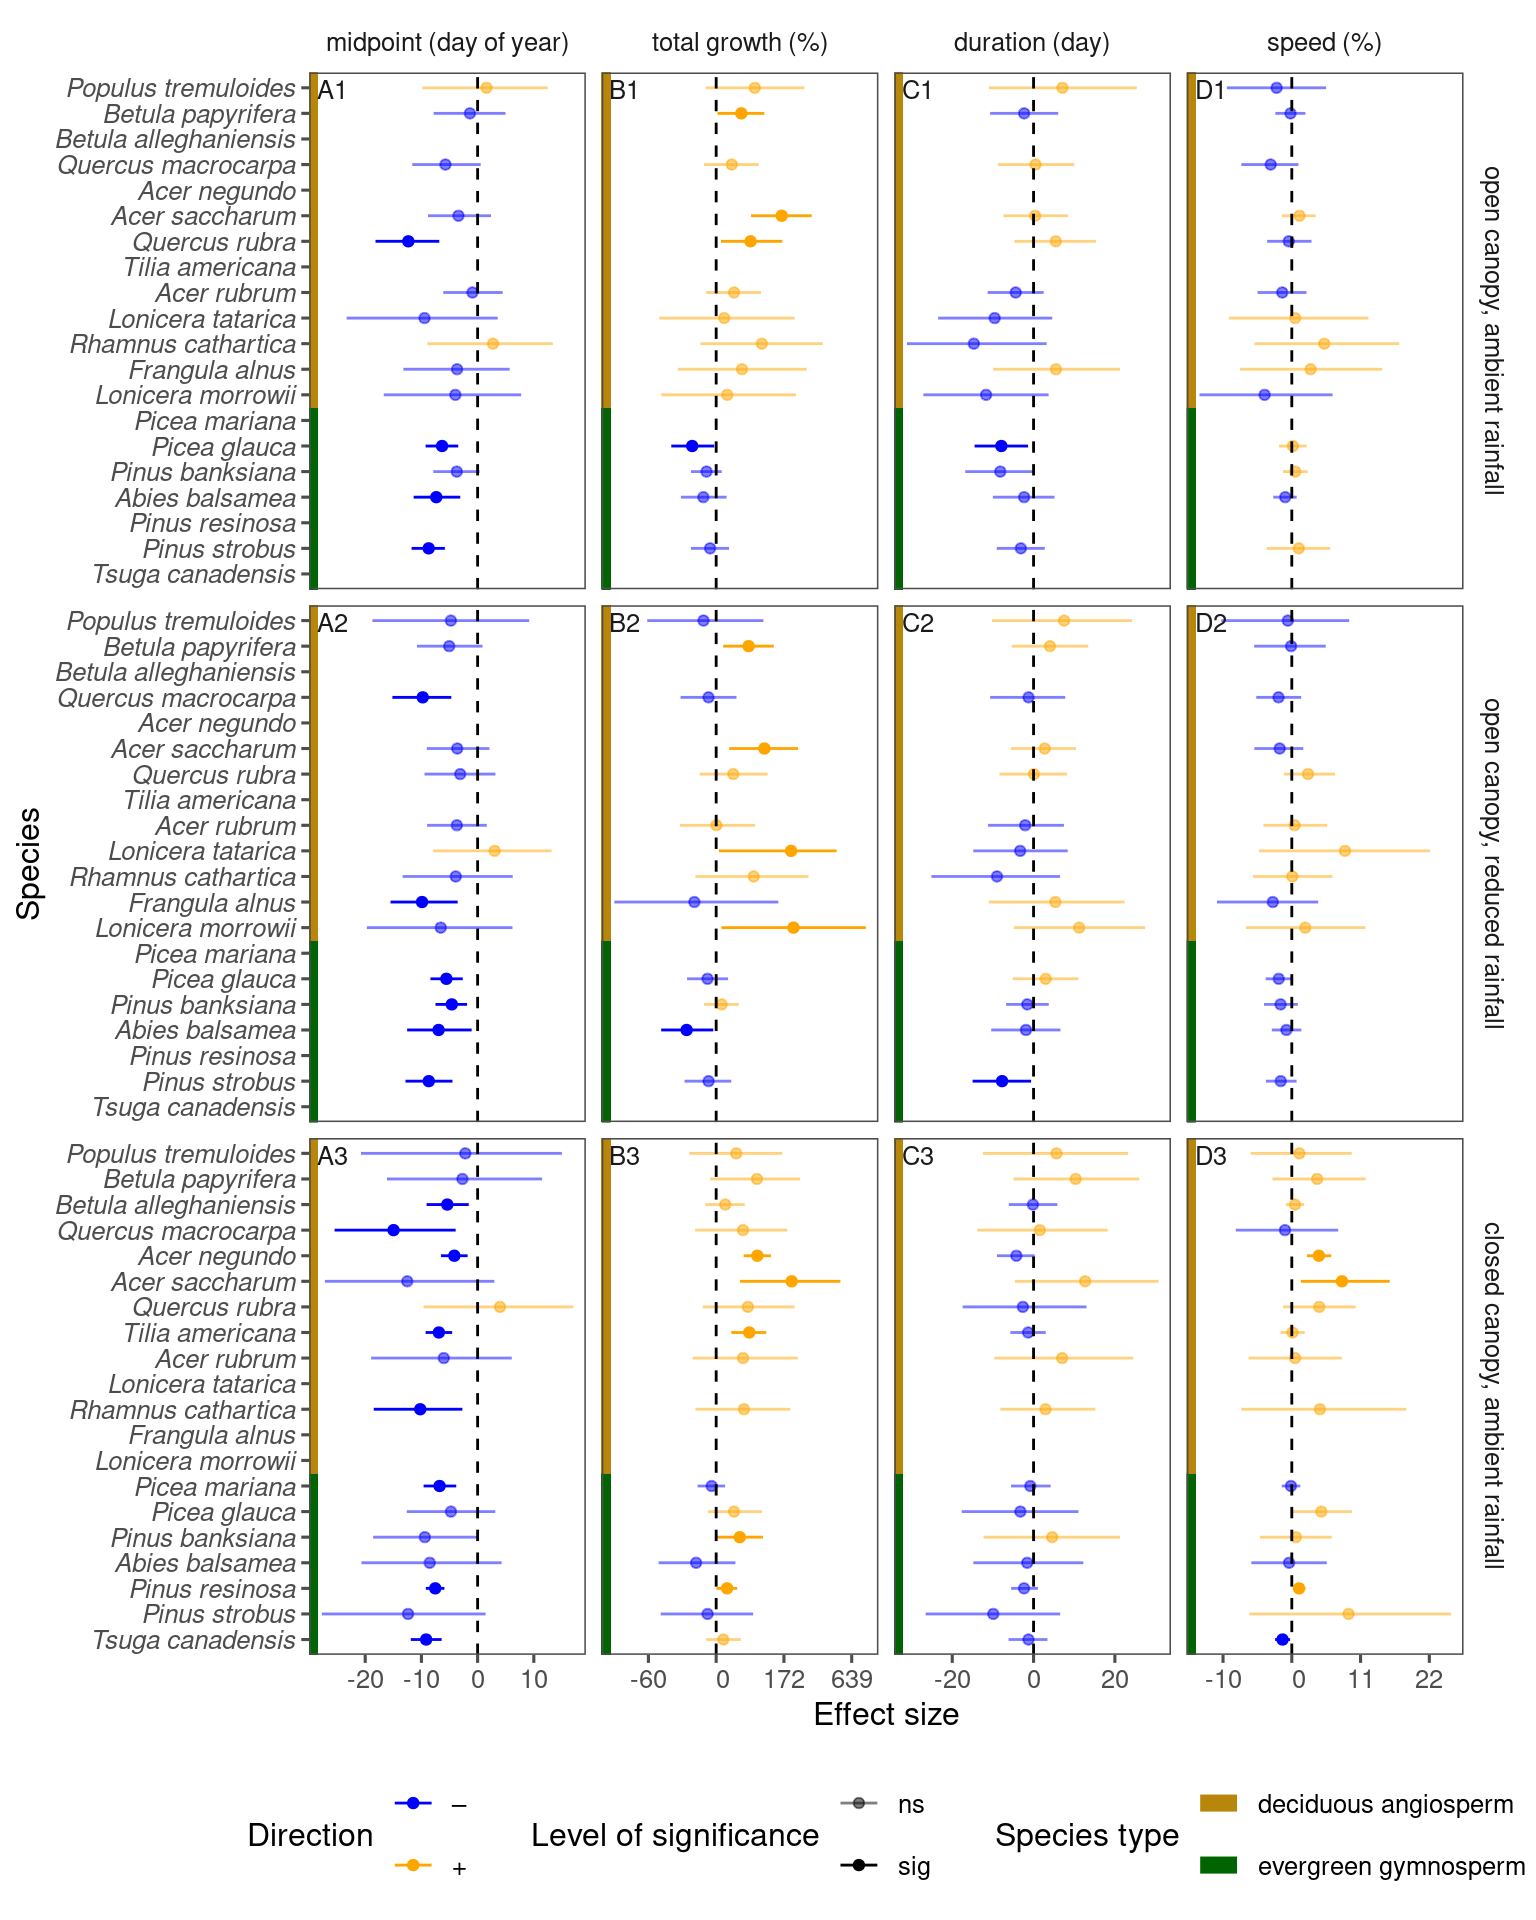
Plot coefficients
Train LME to test the effect of warming treatment on these metrics.
I used a model with one predictor of warming treatment (0,1,2).
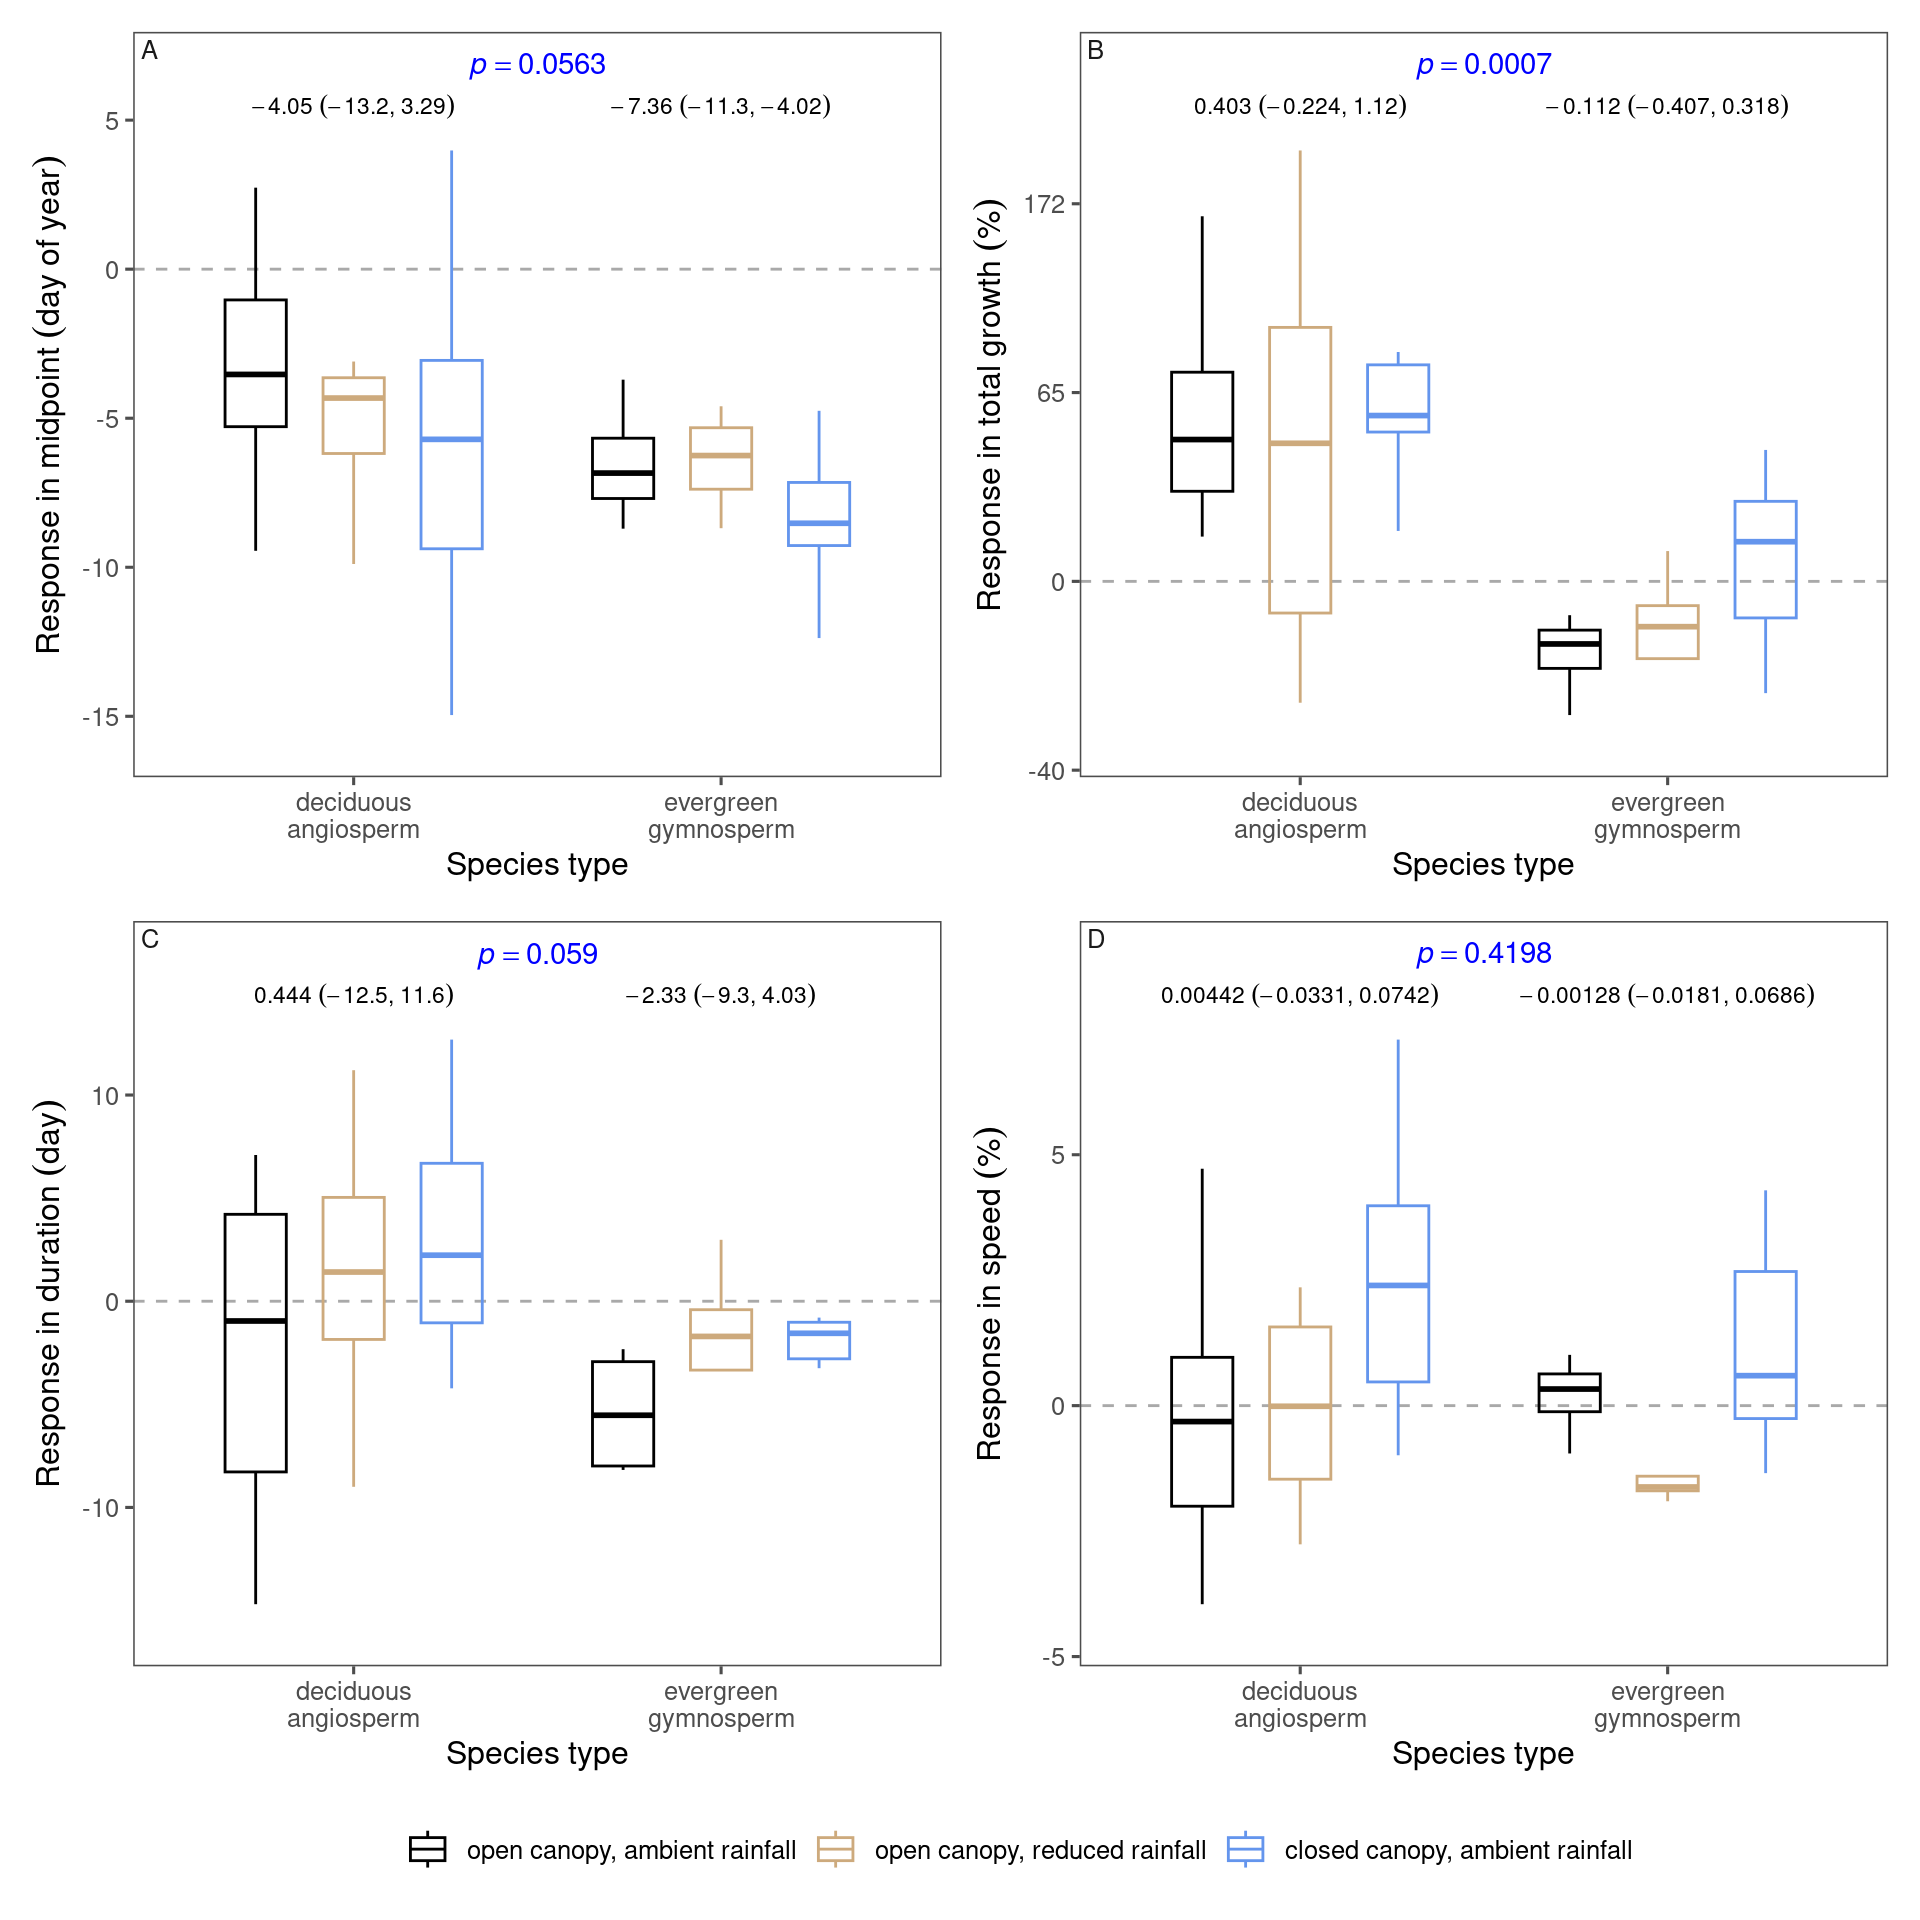
Summarize coefficients by species type
Check correlation between empirically extracted metrics and modelled metrics
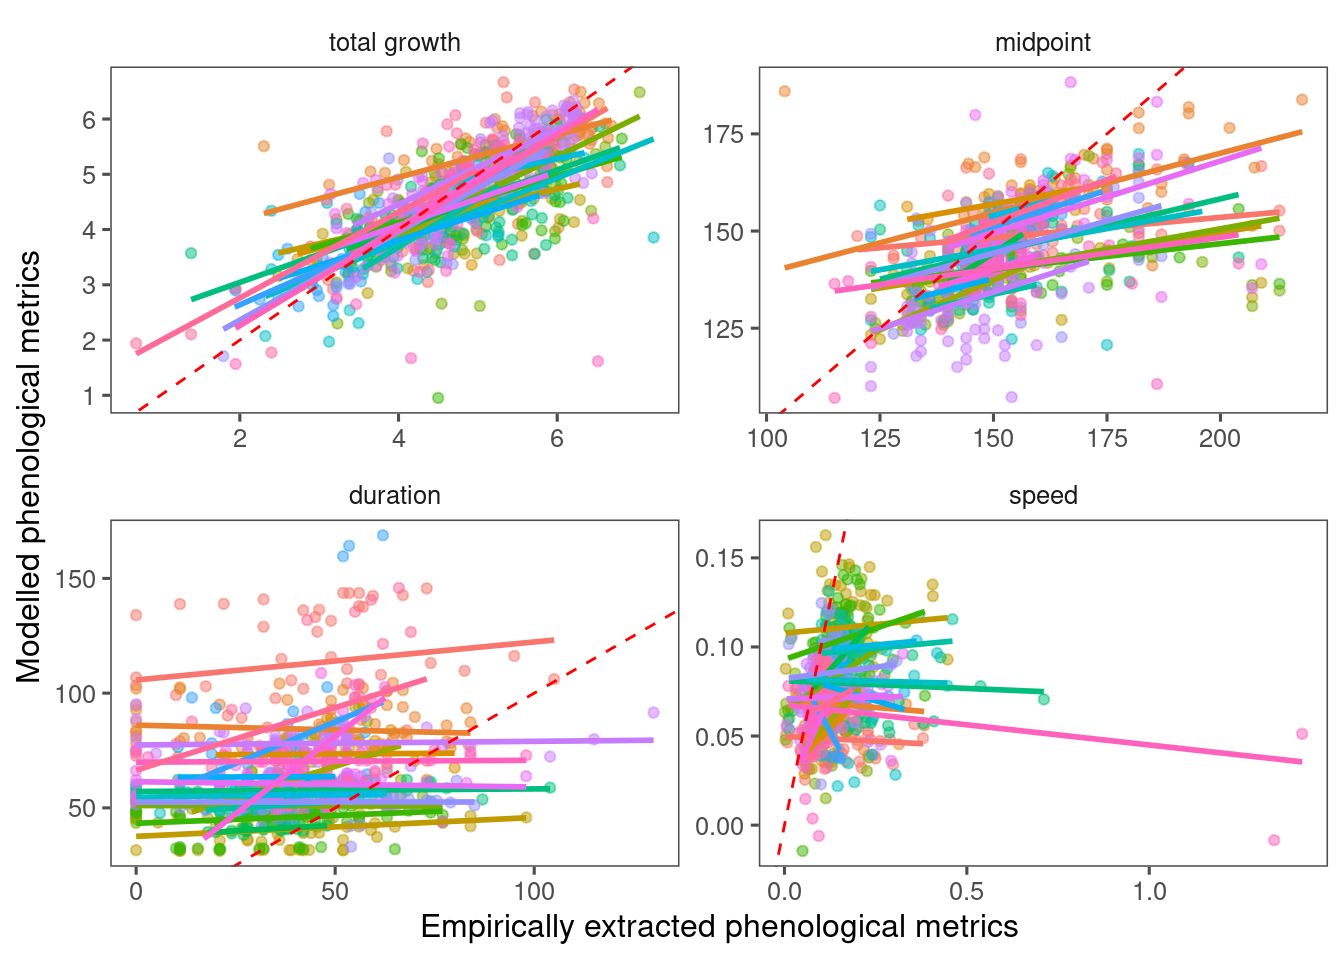
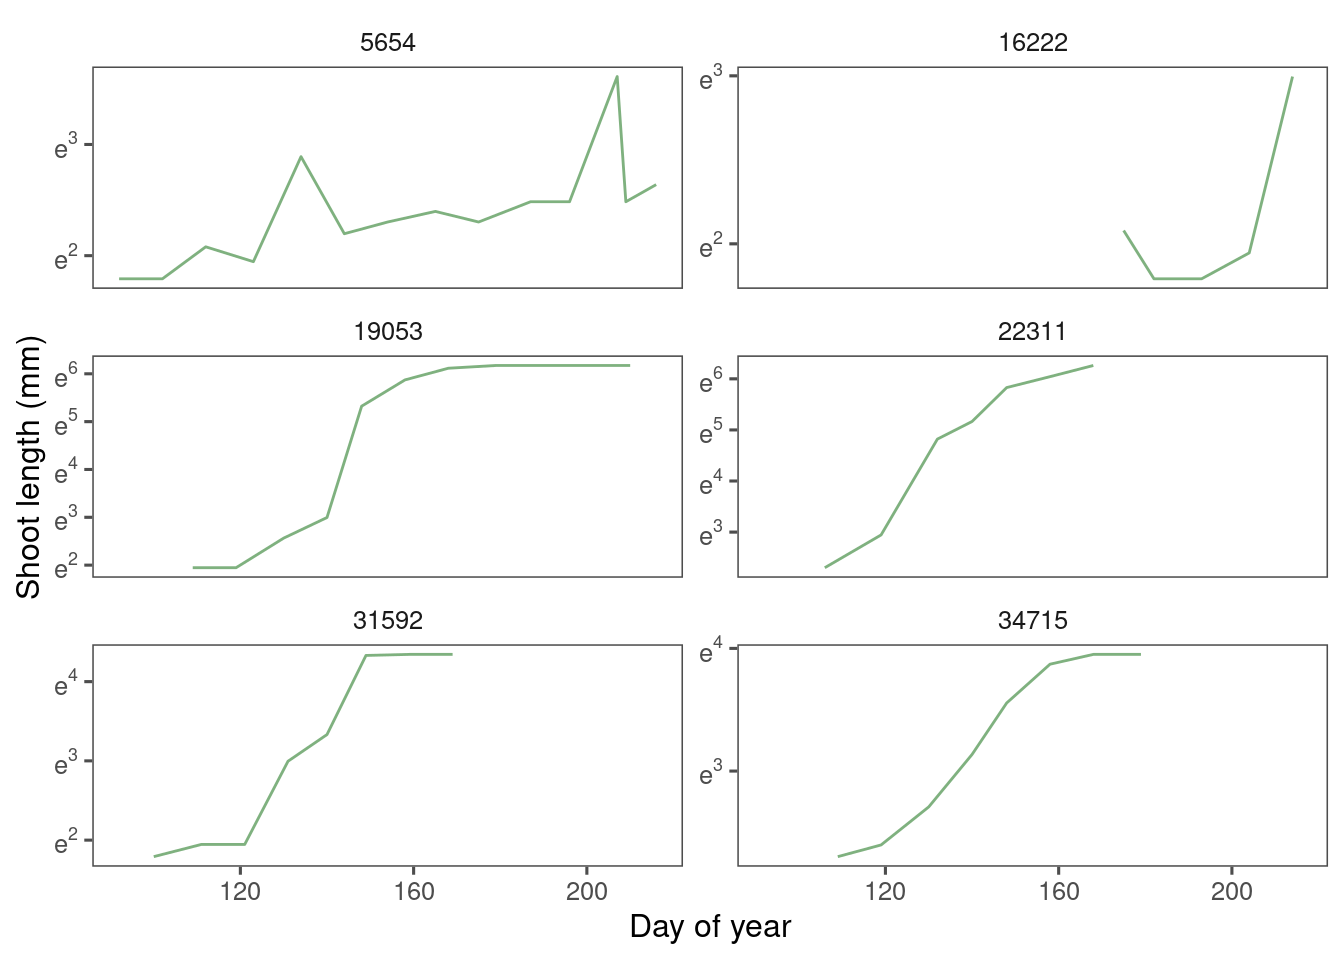
Visualize a random set of shoot growth curves, which might explain the issues with empirically-extracted duration and speed.