Fit nonlinear regression models
The model structures are almost the same as that used in the Bayesian approach, but we use the nls function to fit models and optimize the coefficients. In addition, we infer the effects of 1.7°C and 3.4°C warming separately, without assuming relationships between them.
The motivation for doing this is two-fold.
- As a preliminary test for whether effects of 3.4°C warming doubles those of 1.7°C.
- To verify if the negative correlation between baseline parameter and effect size is an artifact of the Bayesian approach, or something with biological meaning.
Note that this method is fast but it gave some coefficients that are way out of reasonable range, likely due to small sample size. We will filter out those coefficients in the following analysis.
1.7 °C vs. 3.4 °C
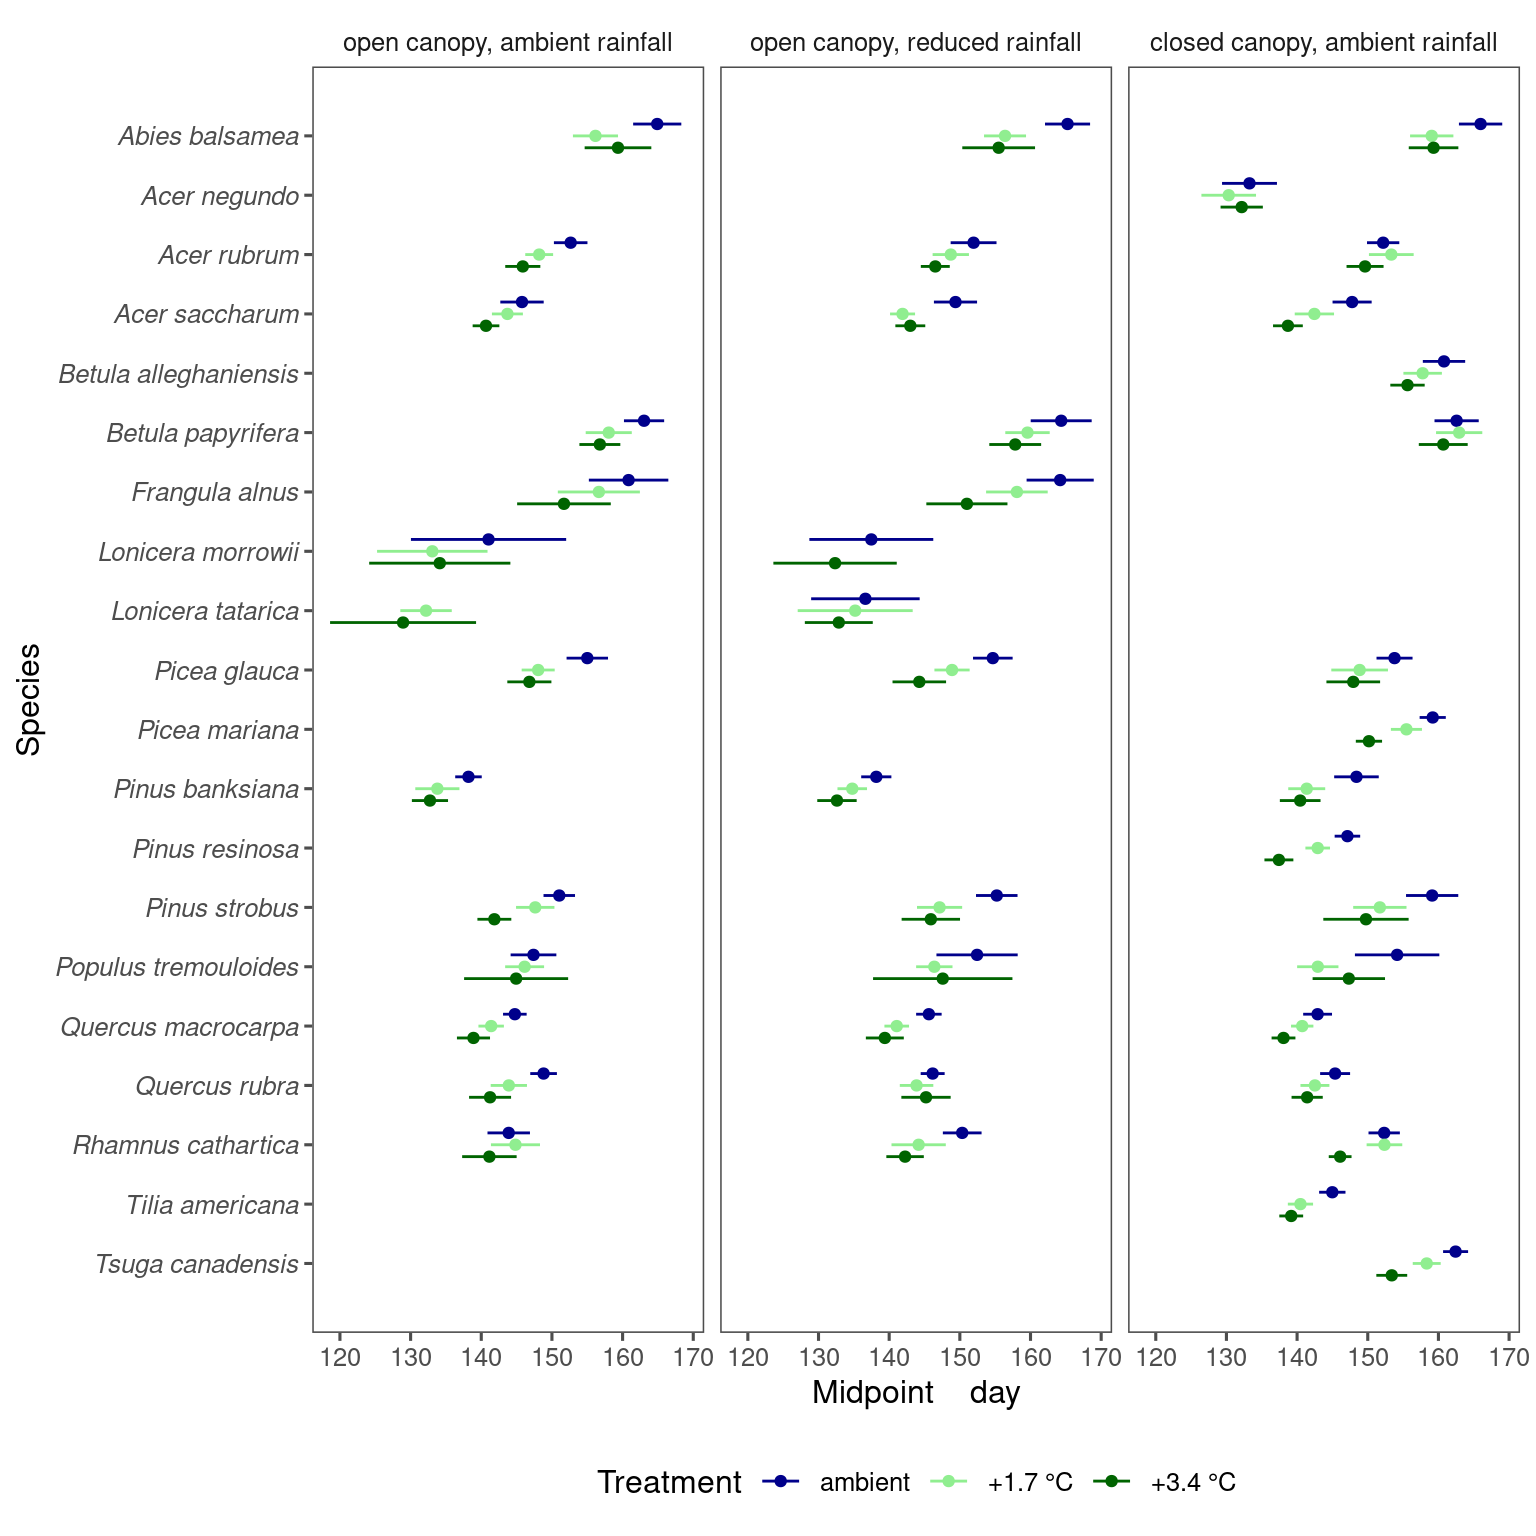
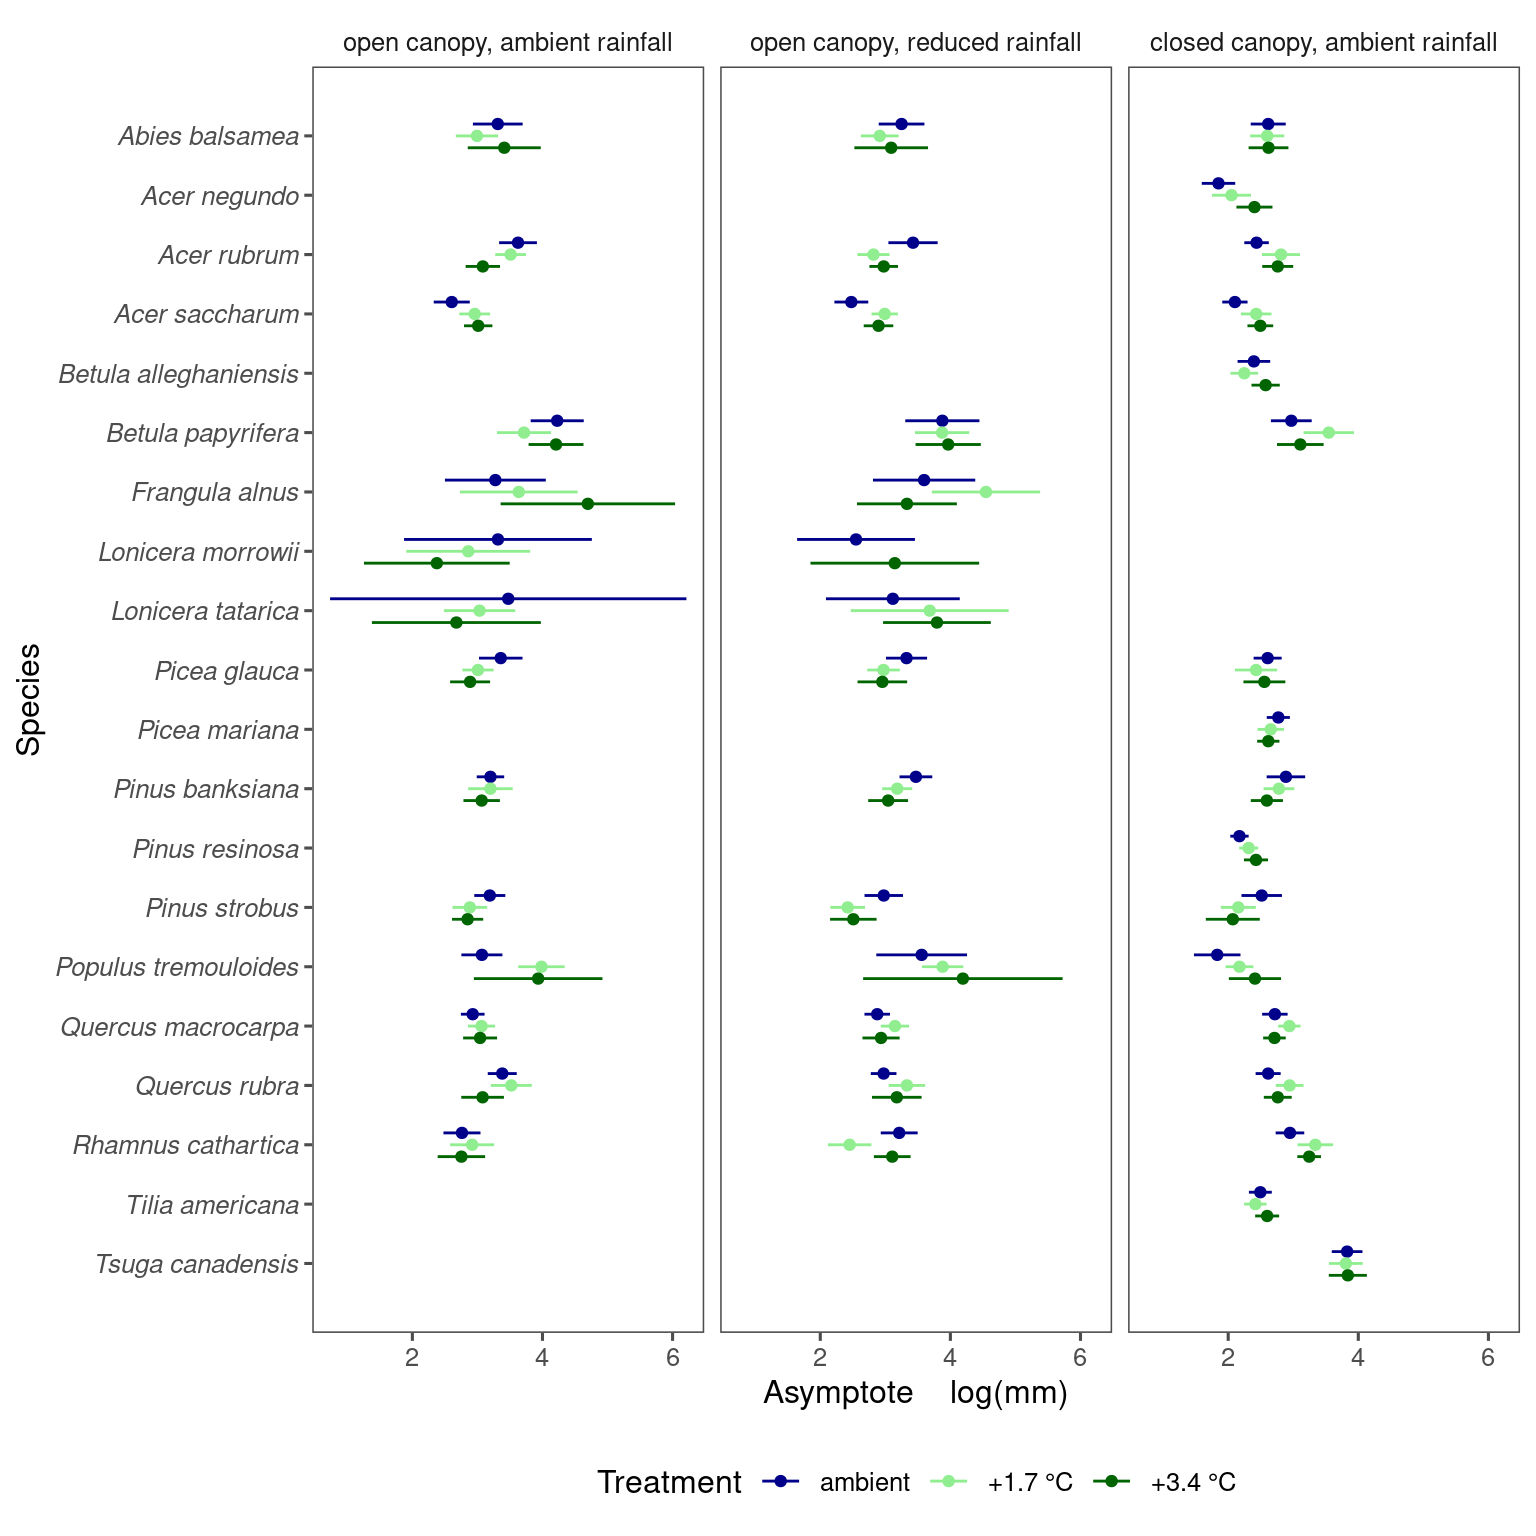
Warming does not always have a linear effect, motivating us to treat 1.7°C and 3.4°C warming as two separate covariates.
Correlation in coefficients
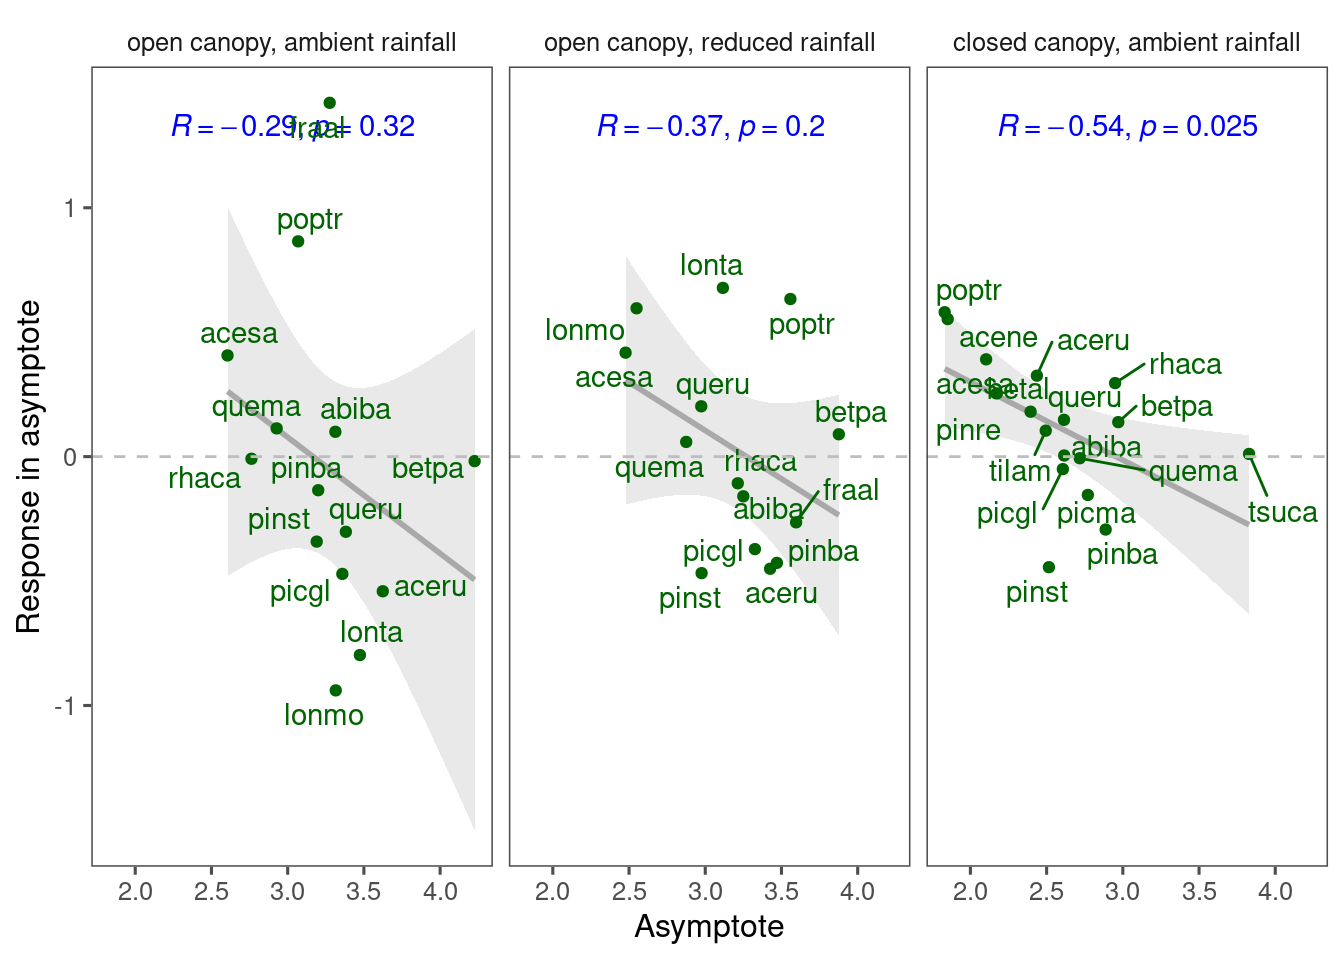
Note that the negative correlation observed with the Bayesian approach is still observed, but the trend is noisier because of species with low sample size, such as fraal, lonmo, lonta, poptr. This tells me that the negative correlation is not an artifact of the Bayesian approach, and that the inference from frequentist approach might not be as robust.