Fit separate models
Previously, for each species, we fit a full model with warming treatment, drying treatment, and canopy treatment in the same model. Now, for each species, we fit three separate models: open canopy & ambient rainfall, open canopy & reduced rainfall, and closed canopy & ambient rainfall. Some models might be skipped depending on the factorial design for that species.
The factors that might cause the two types of models to be different: - Site-year-level random effect: The full model has a single set of site-year-level random effects for a species, while the separate models have a set of site-year-level random effects for each model. Do we think that site and year has the same effect on ambient treatments in the ambient, drying, and closed canopy conditions? If yes -> full model; if no -> separate models. - Minimum value: The full model assumes that the minimum value is the same across all treatments, which I think is a fair assumption. - Distribution: The full model assumes that the error distribution is the same across all treatments, while the separate models allow for different distributions for each model. - Sample size: Full model might have more stable parameter estimates given larger sample size.
Compare with full model
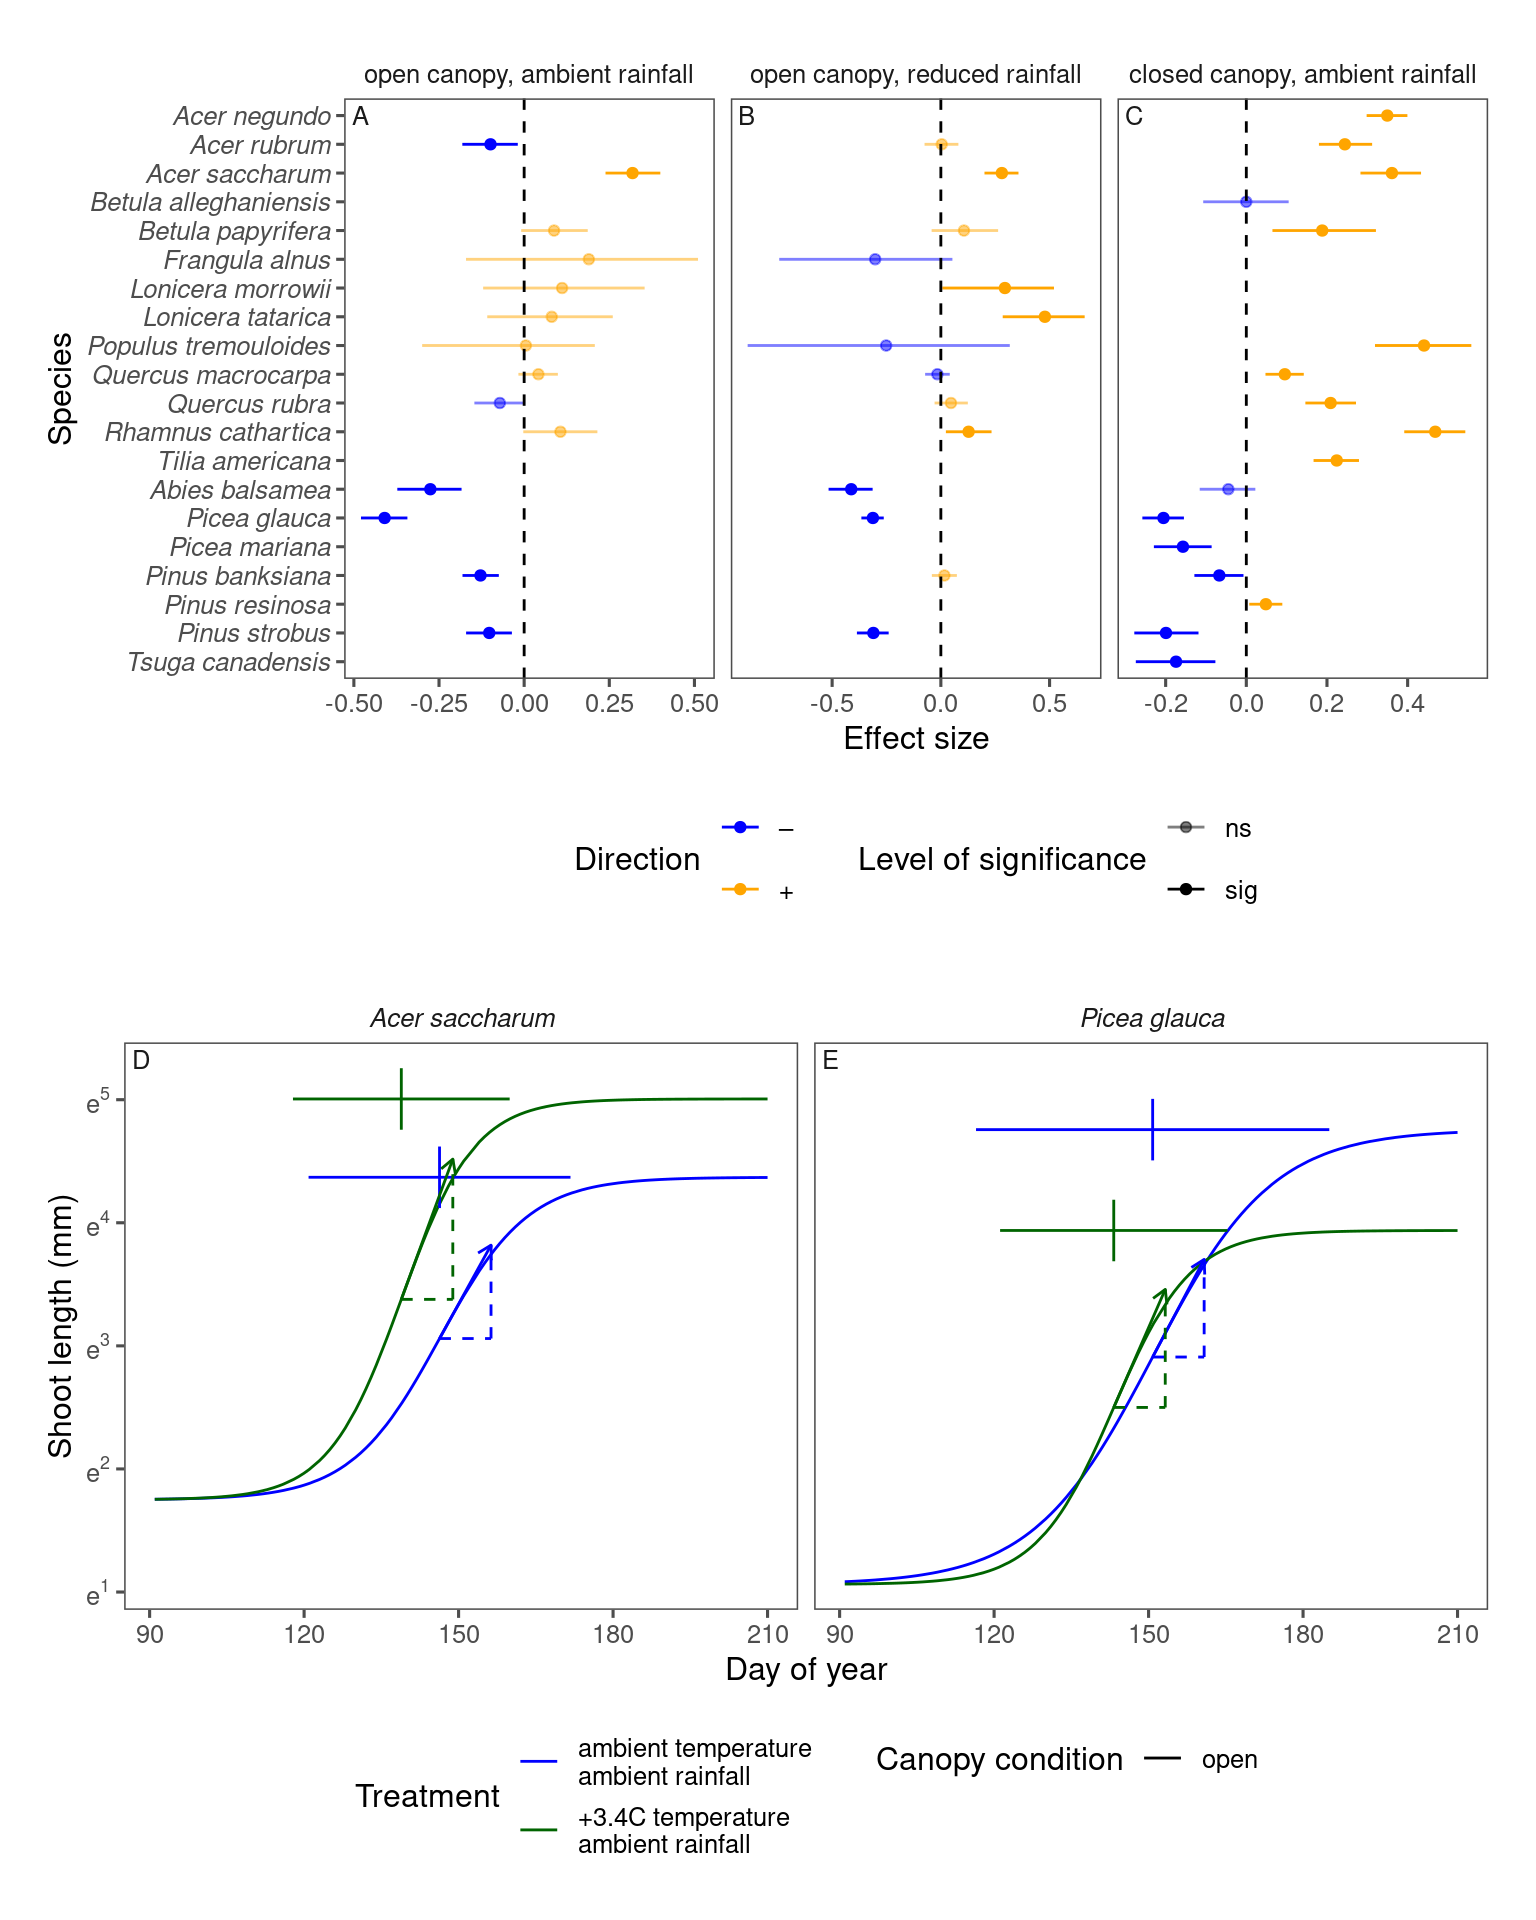
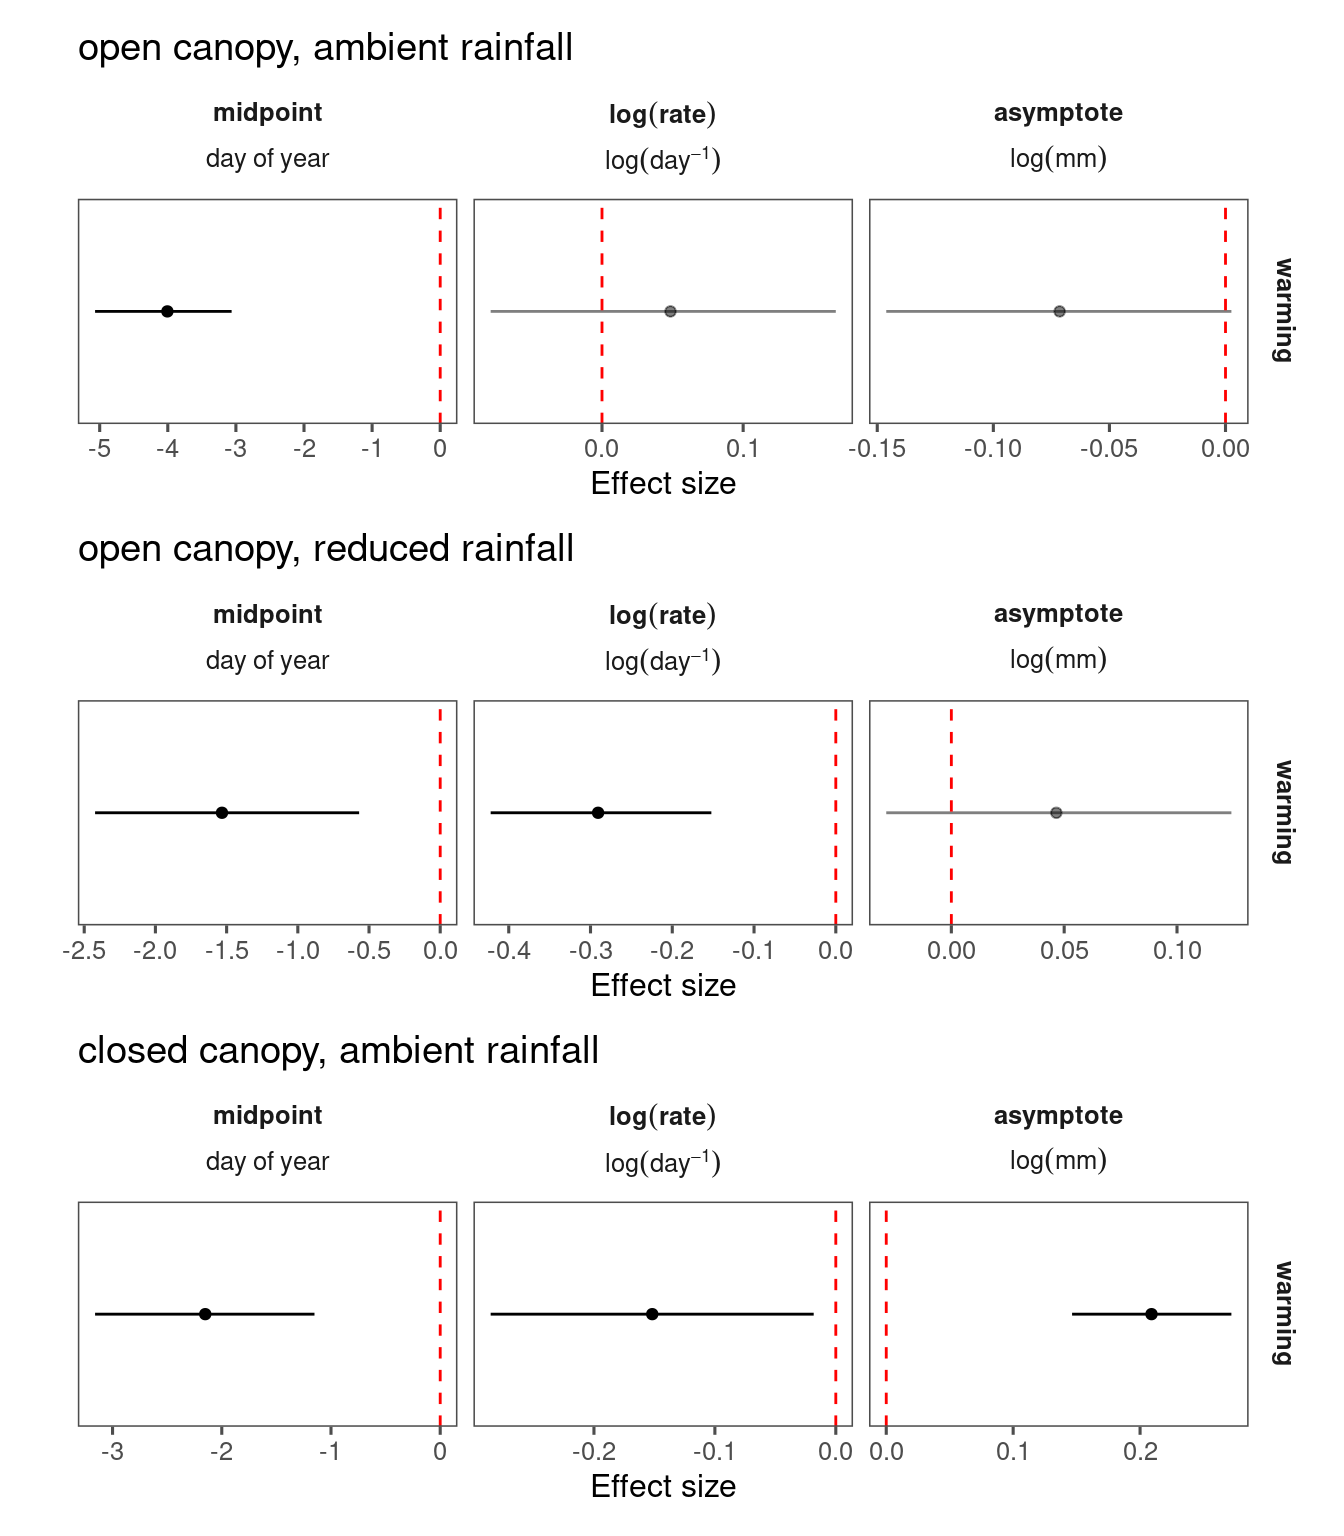
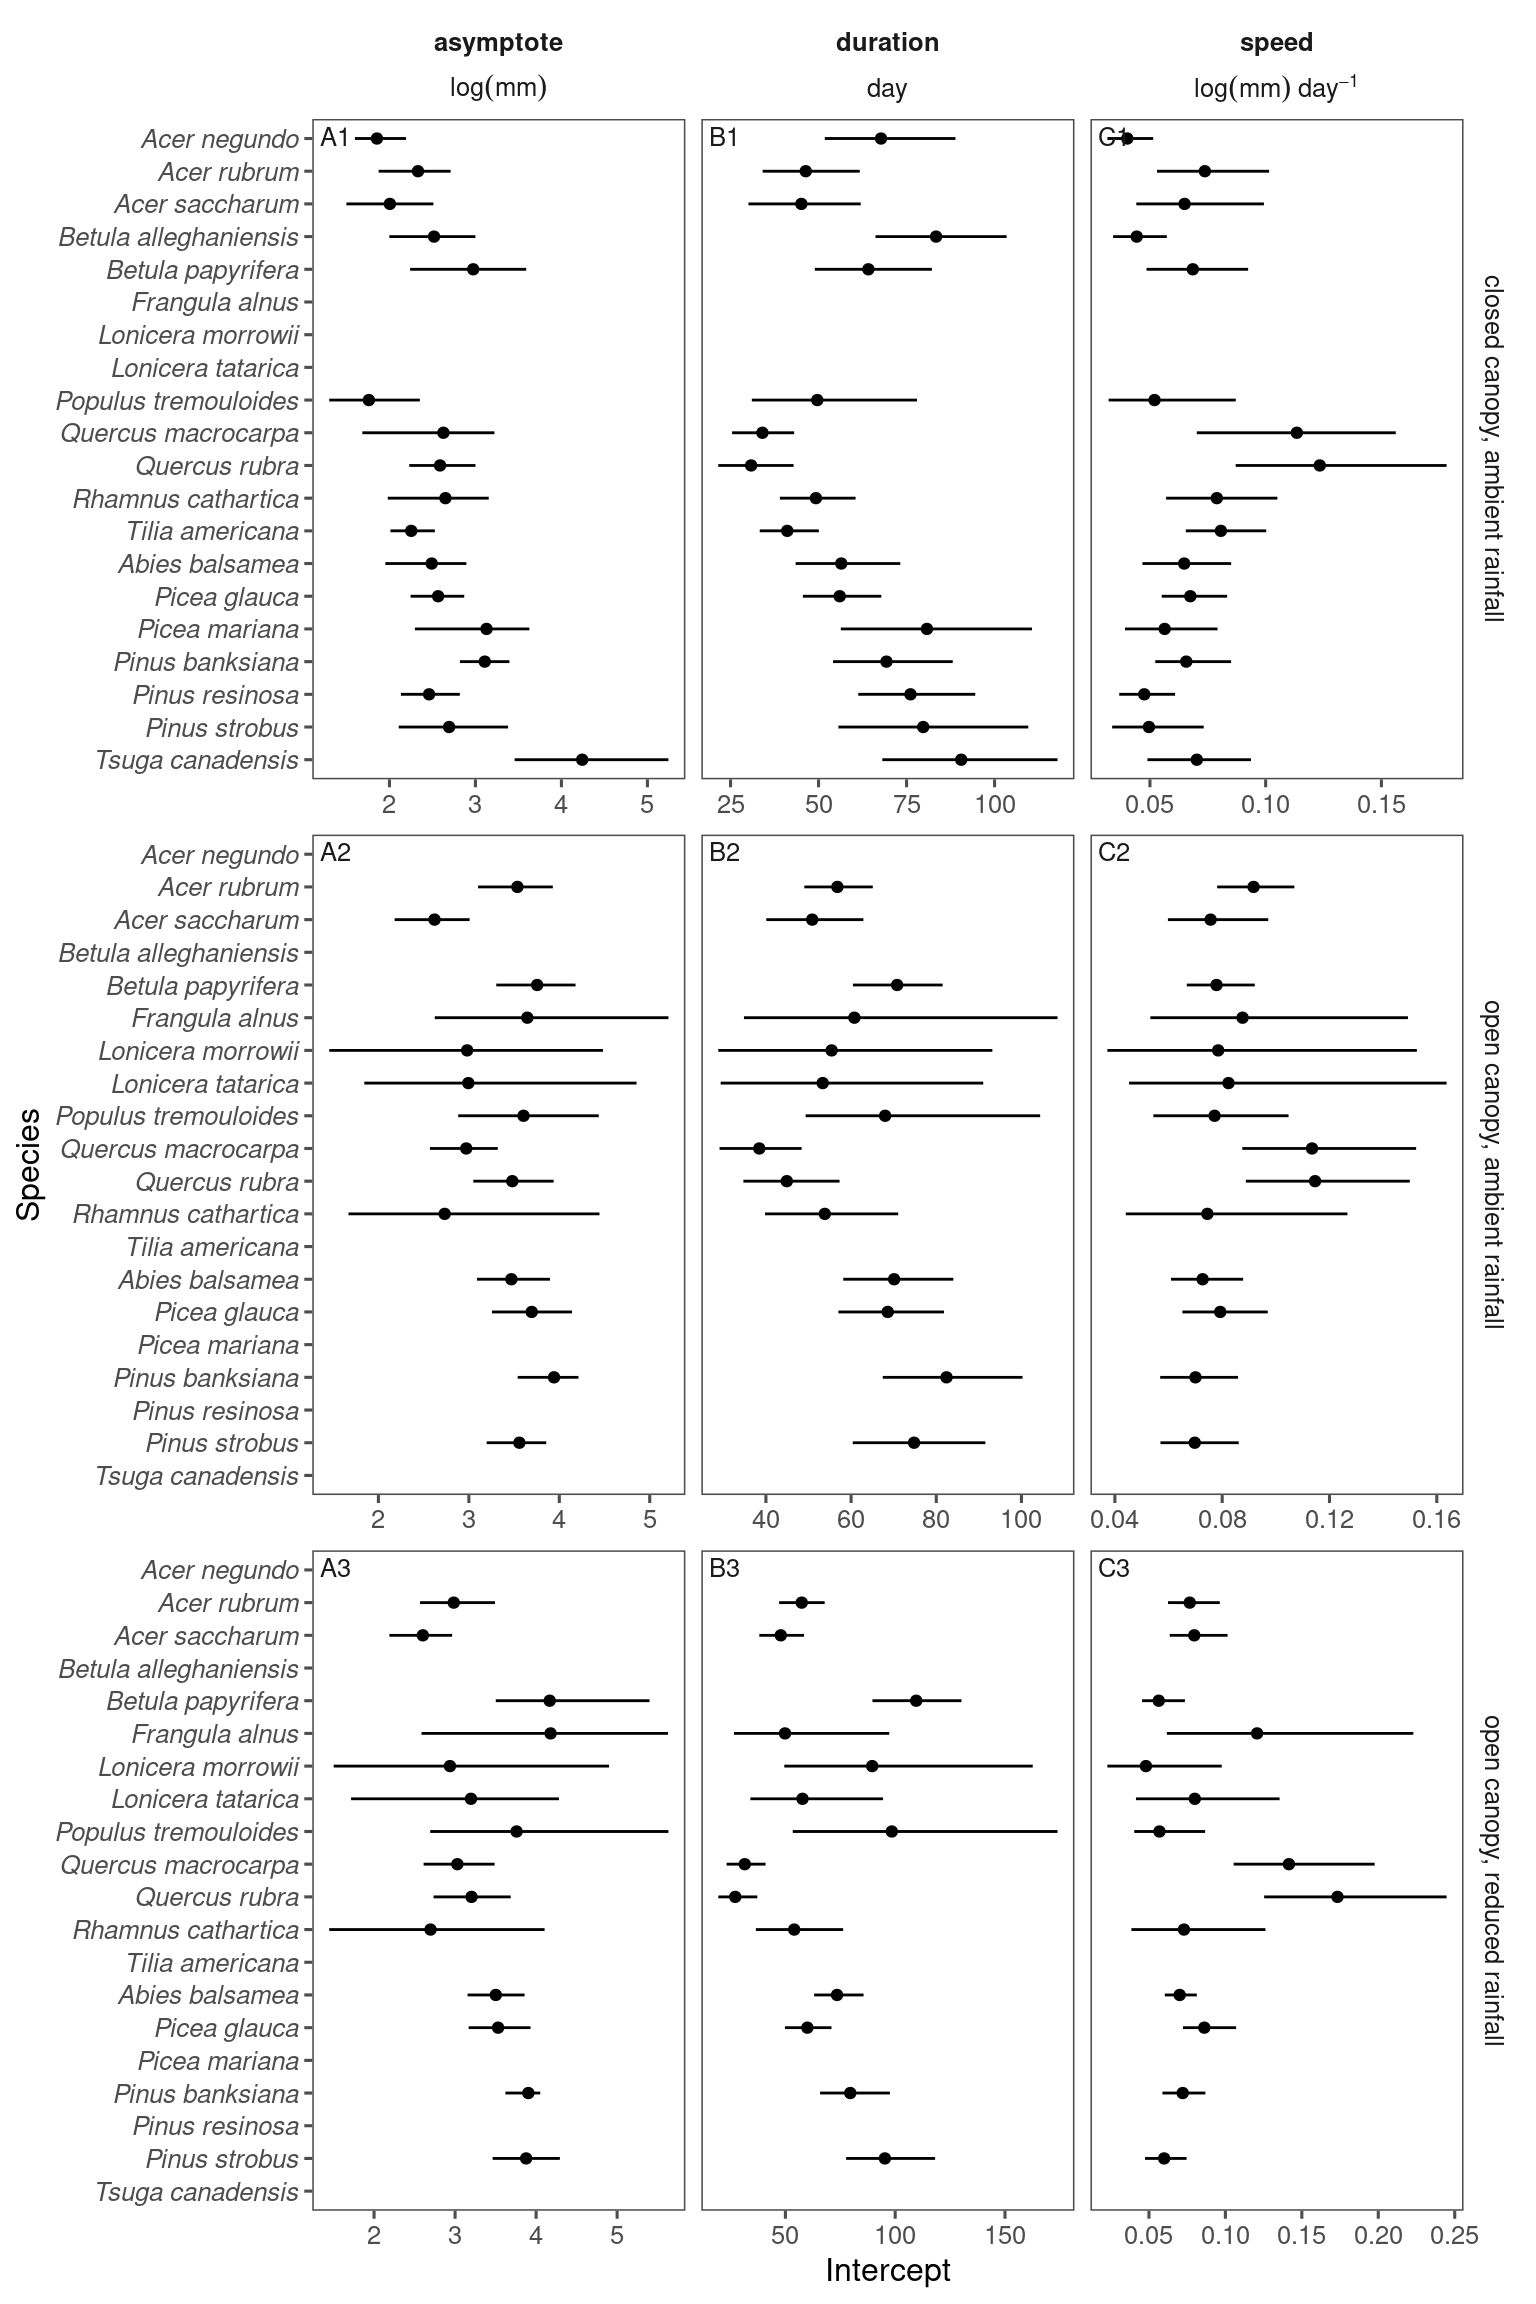
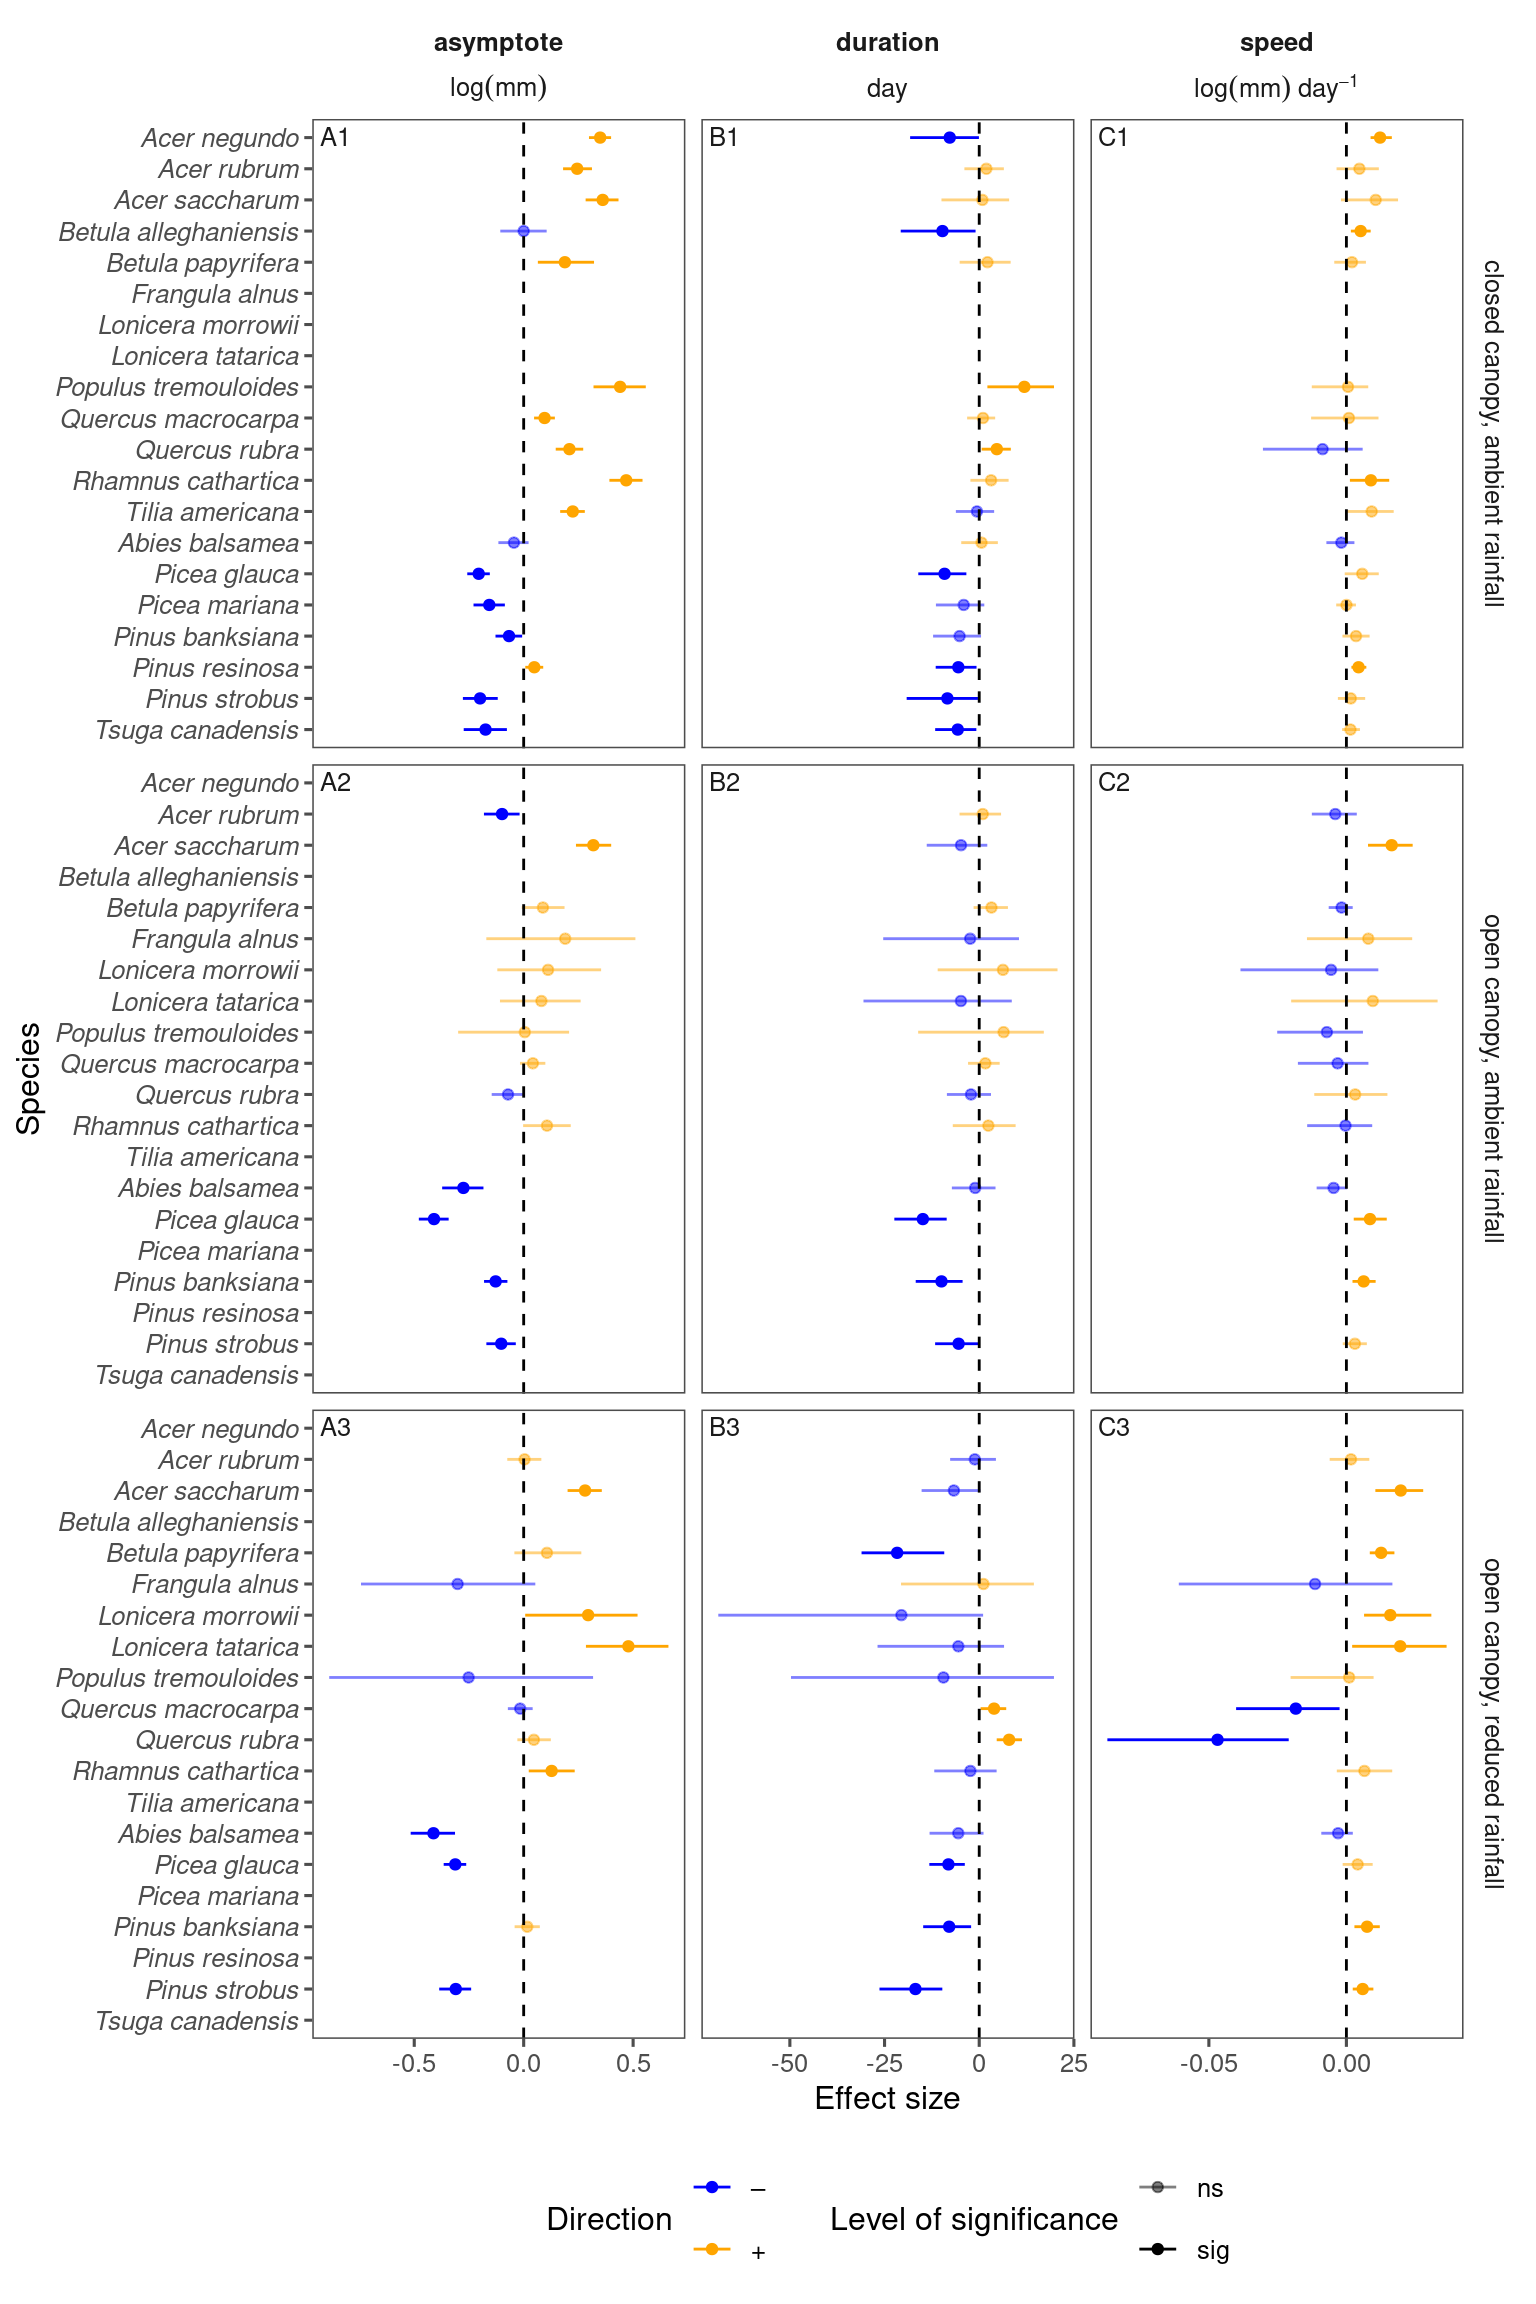
Inferred coefficients from three separate models.
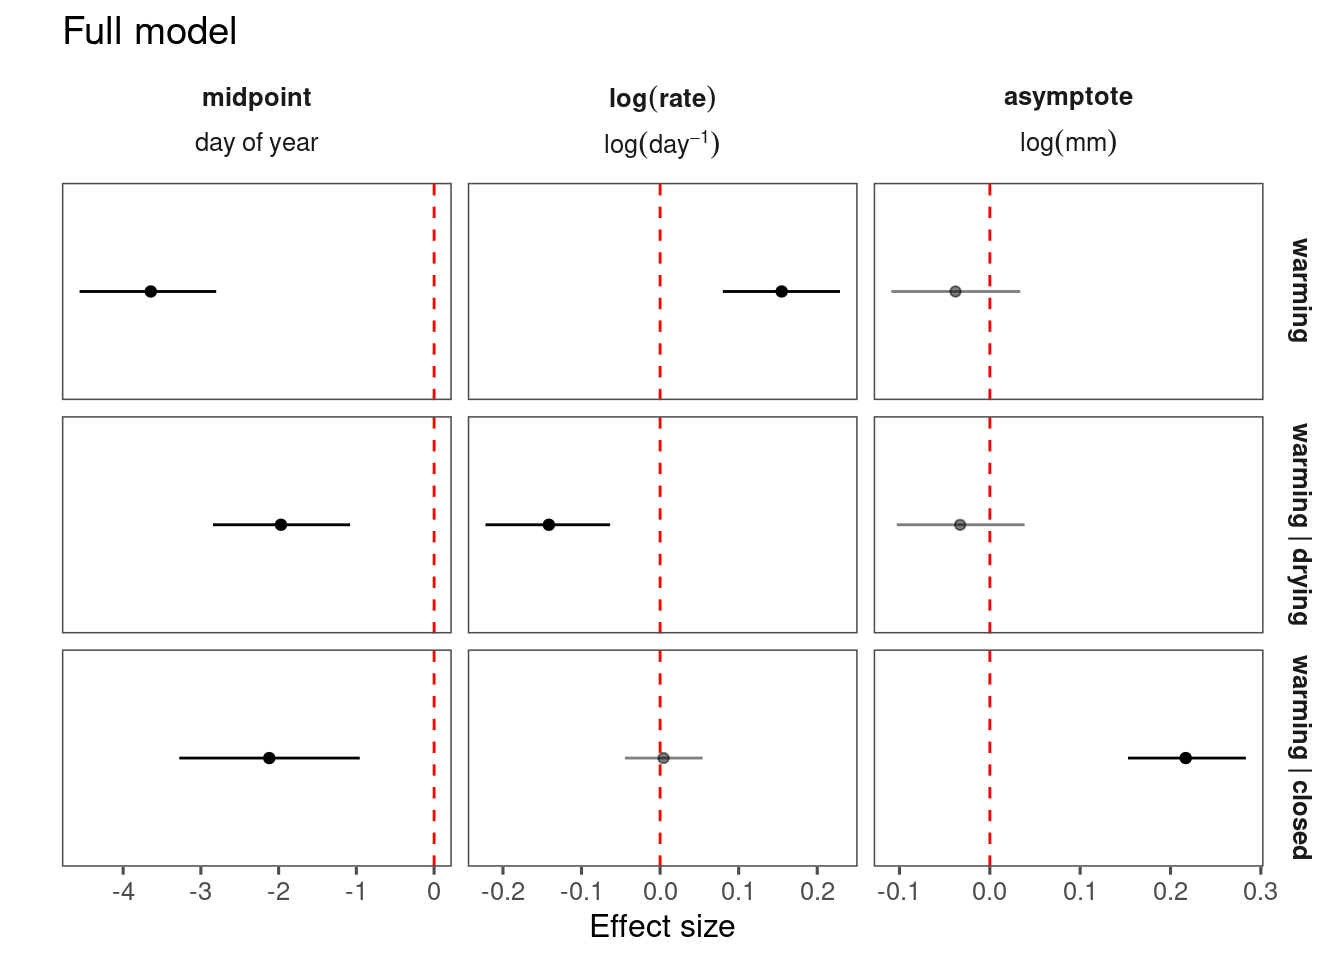
Inferred coefficients from full model.
Numerical summary of coefficients from separate models.
## # A tibble: 3 × 7
##   param     response  model                      median   lower   upper category
##   <chr>     <fct>     <fct>                       <dbl>   <dbl>   <dbl> <fct>
## 1 beta_A.1. amplitude open canopy, ambient rai… -0.0714 -0.146  0.00253 negativ…
## 2 beta_A.1. amplitude open canopy, reduced rai…  0.0465 -0.0288 0.124   positiv…
## 3 beta_A.1. amplitude closed canopy, ambient r…  0.209   0.146  0.272   positiv…
Numerical summary of coefficients from the full model.
## # A tibble: 3 × 7
##   param     response  covariate         median  lower  upper category
##   <chr>     <fct>     <fct>              <dbl>  <dbl>  <dbl> <fct>
## 1 beta_A.1. amplitude warming          -0.0380 -0.109 0.0337 negative (non-sign…
## 2 beta_A.3. amplitude warming | drying -0.0329 -0.103 0.0385 negative (non-sign…
## 3 beta_A.5. amplitude warming | closed  0.217   0.153 0.283  positive (signific…
Marginal predictions from separate models.
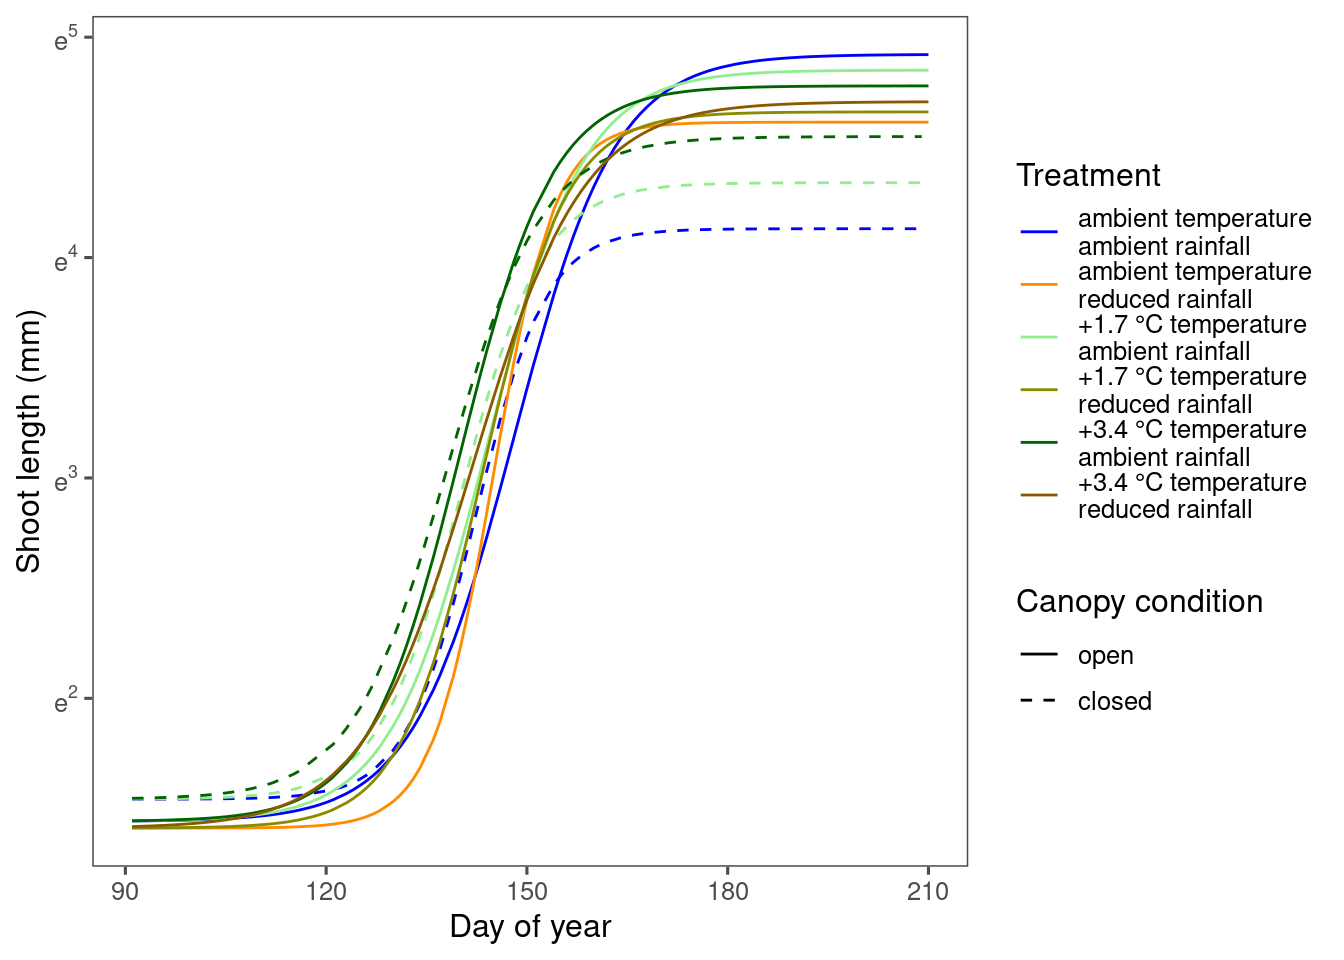
Marginal predictions from full models.

There are some differences in predictions they are generally very similar, especially when considering the uncertainty.
Summary of baselines
Summary of coefficients
Composite figure